
Rok Monitoring
Learning how to monitor Rok is of vital importance when running Arrikto EKF in production. Monitoring your Rok cluster lets you validate that EKF performs as expected, while detecting and troubleshooting issues in a timely manner.
Monitoring the performance and status of Rok is key to keep your EKF cluster functional. The Rok Monitoring Stack helps you inspect the data storage and management layer of your EKF cluster by collecting and visualizing Prometheus metrics directly exposed by Rok. This allows you to maintain high levels of performance and availability.
This guide also contains commands that you can run to access the Rok Grafana dashboard. Here is what you will need to follow them:
- An existing Kubernetes cluster.
- An existing Rok deployment.
Important
Before proceeding, ensure that you have been granted proper rights to access the Rok Monitoring Stack UI. Currently, access to the Rok Monitoring Stack is allowed only to admin users.
Introduction
Rok uses Prometheus for metrics reporting at the /metrics HTTP endpoint.
The metrics that Rok exposes can be used for real-time monitoring, performance
evaluation and debugging. Rok does not persist the metrics it exposes, that is,
metrics are reset upon restarts.
To persist Rok metrics on Kubernetes, the Rok Monitoring Stack creates a
ServiceMonitor custom resource in the namespace where Rok is deployed to
configure Rok Prometheus to periodically pull metrics from Rok and save them in
its time-series database.
Note
By default, Rok Prometheus retains metrics for 3 days.
Metrics
Rok exposes aggregated, application-level metrics through its API, under the
rok prefix. Rok Prometheus collects and stores all metrics that Rok
exposes, while Rok Grafana retrieves and visualizes these metrics to monitor
the following areas:
- cluster information (software version, configuration version, license)
- accounts, buckets, objects, versions
- API requests/responses
Note
We are gradually extending the list of Prometheus metrics that Rok exposes.
In the table below you can view which Rok metrics are included in the Rok Grafana dashboard:
| Name | Description | Type |
|---|---|---|
rok_info |
Software info (version, cluster config) | Gauge |
rok_accounts |
Number of accounts | Gauge |
rok_buckets |
Number of buckets, across all accounts | Gauge |
rok_objects |
Number of objects, across all accounts and buckets | Gauge |
rok_versions |
Number of versions, across all accounts, buckets and objects | Gauge |
rok_objects_bytes |
Size of objects, across all accounts and buckets | Gauge |
rok_versions_bytes |
Size of versions, across all accounts, buckets and objects | Gauge |
rok_http_requests_total |
Number of HTTP requests | Counter |
rok_http_responses_total |
Number of HTTP responses | Counter |
rok_http_request_duration_seconds |
Request duration | Histogram |
rok_http_request_body_size |
Request body size | Histogram |
rok_http_response_body_size |
Response body size | Histogram |
View Grafana Dashboard
Note
The Rok Monitoring Stack places Grafana dashboards for individual EKF
components under the EKF folder.
Visit the Kubeflow central dashboard with your browser at
https://<FQDN>Replace
<FQDN>with your the value of your domain. For example:https://arrikto-cluster.apps.example.comIf prompted, log in using your credentials:
Select
Metricsfrom the left side bar to navigate to Grafana: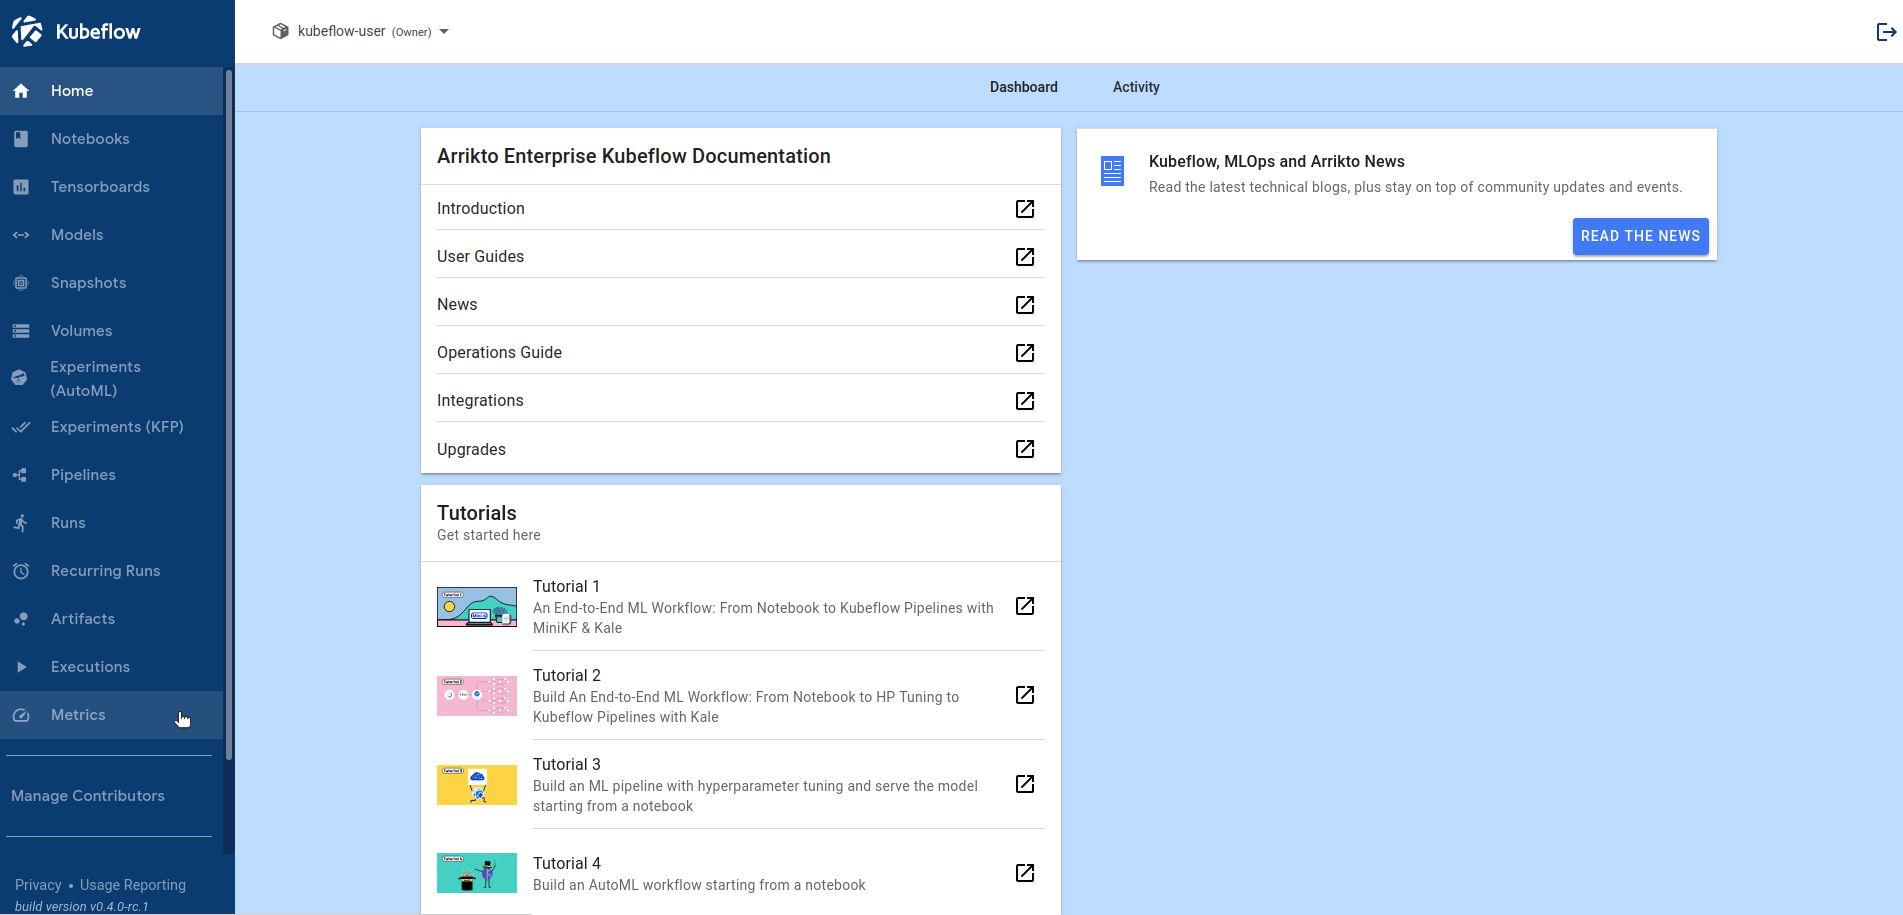
In the left side bar, hover your cursor over the
Dashboardsentry and then clickManageto navigate to the Grafana Dashboards page: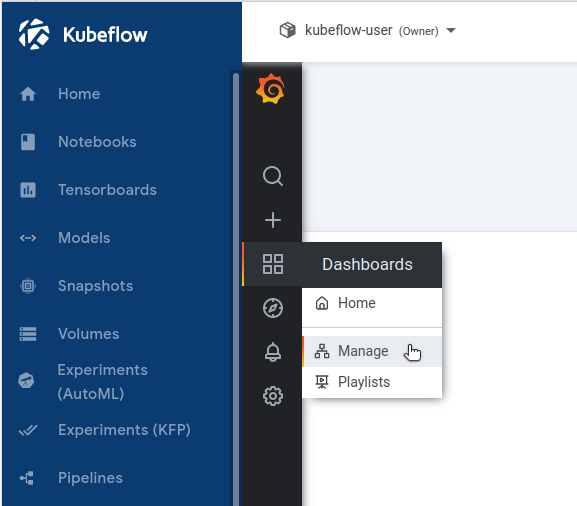
Note
In the Grafana Dashboards page you can search, view, and select dashboards.
Go to the
EKFfolder and select theRokdashboard: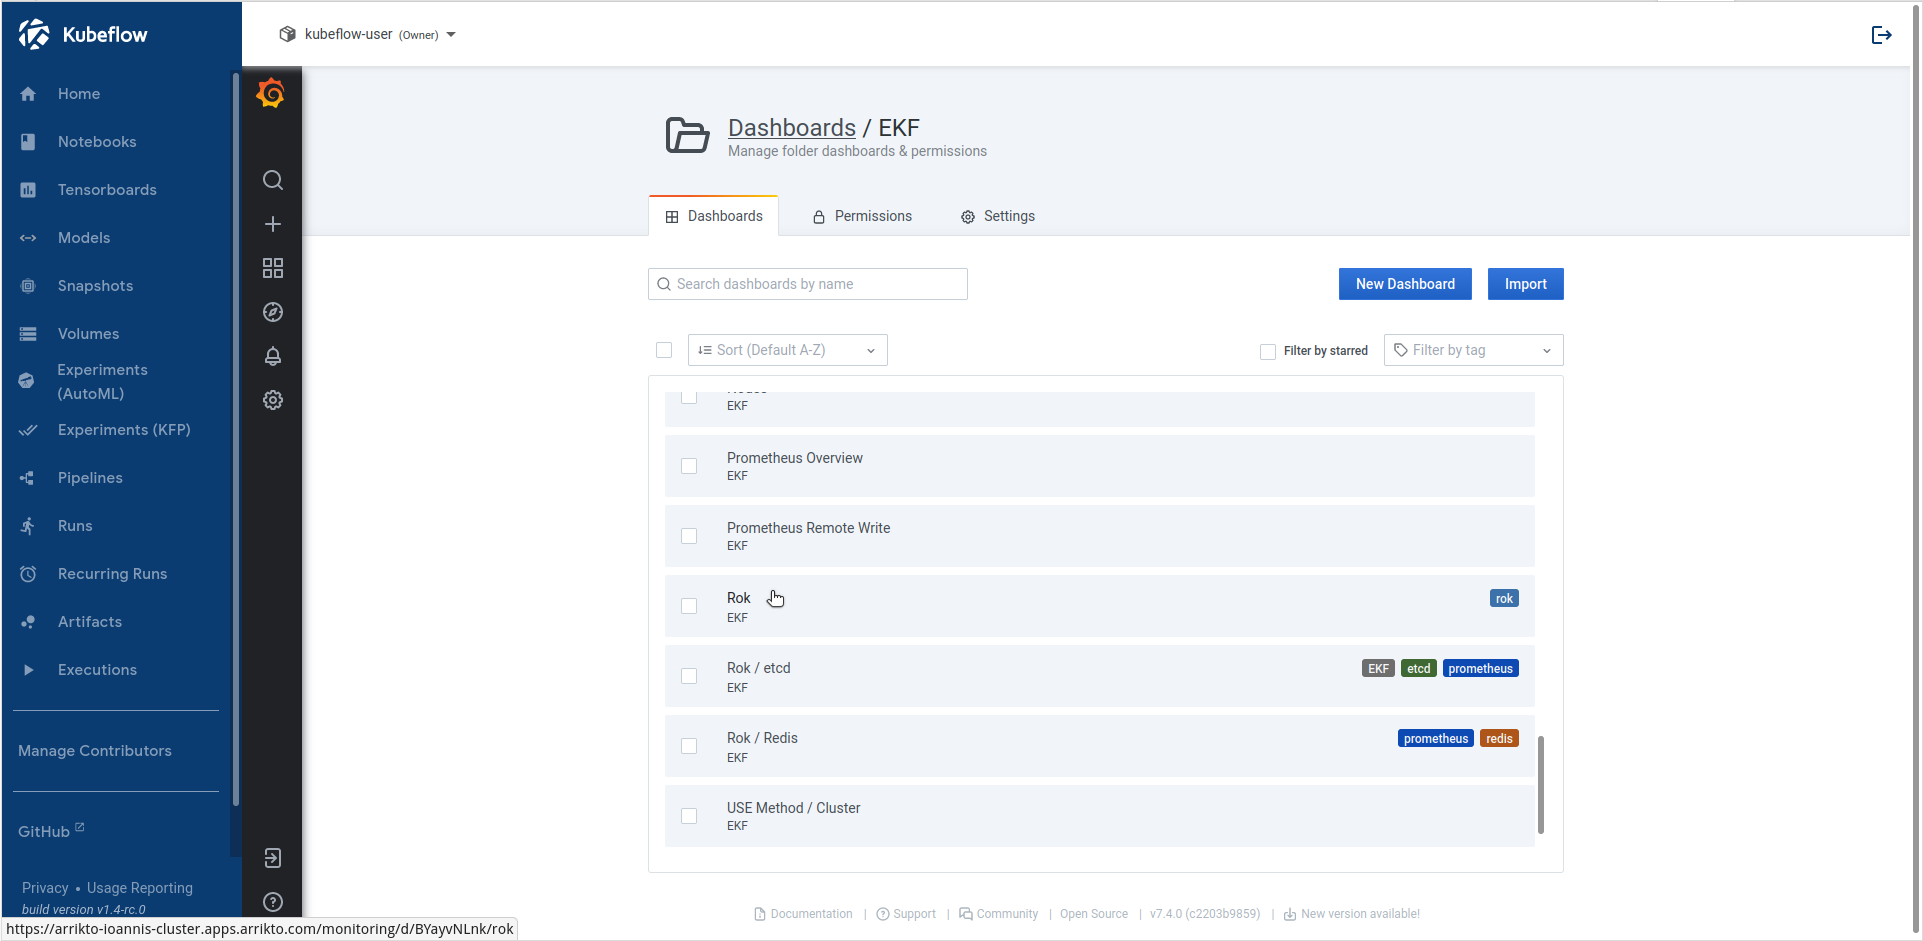
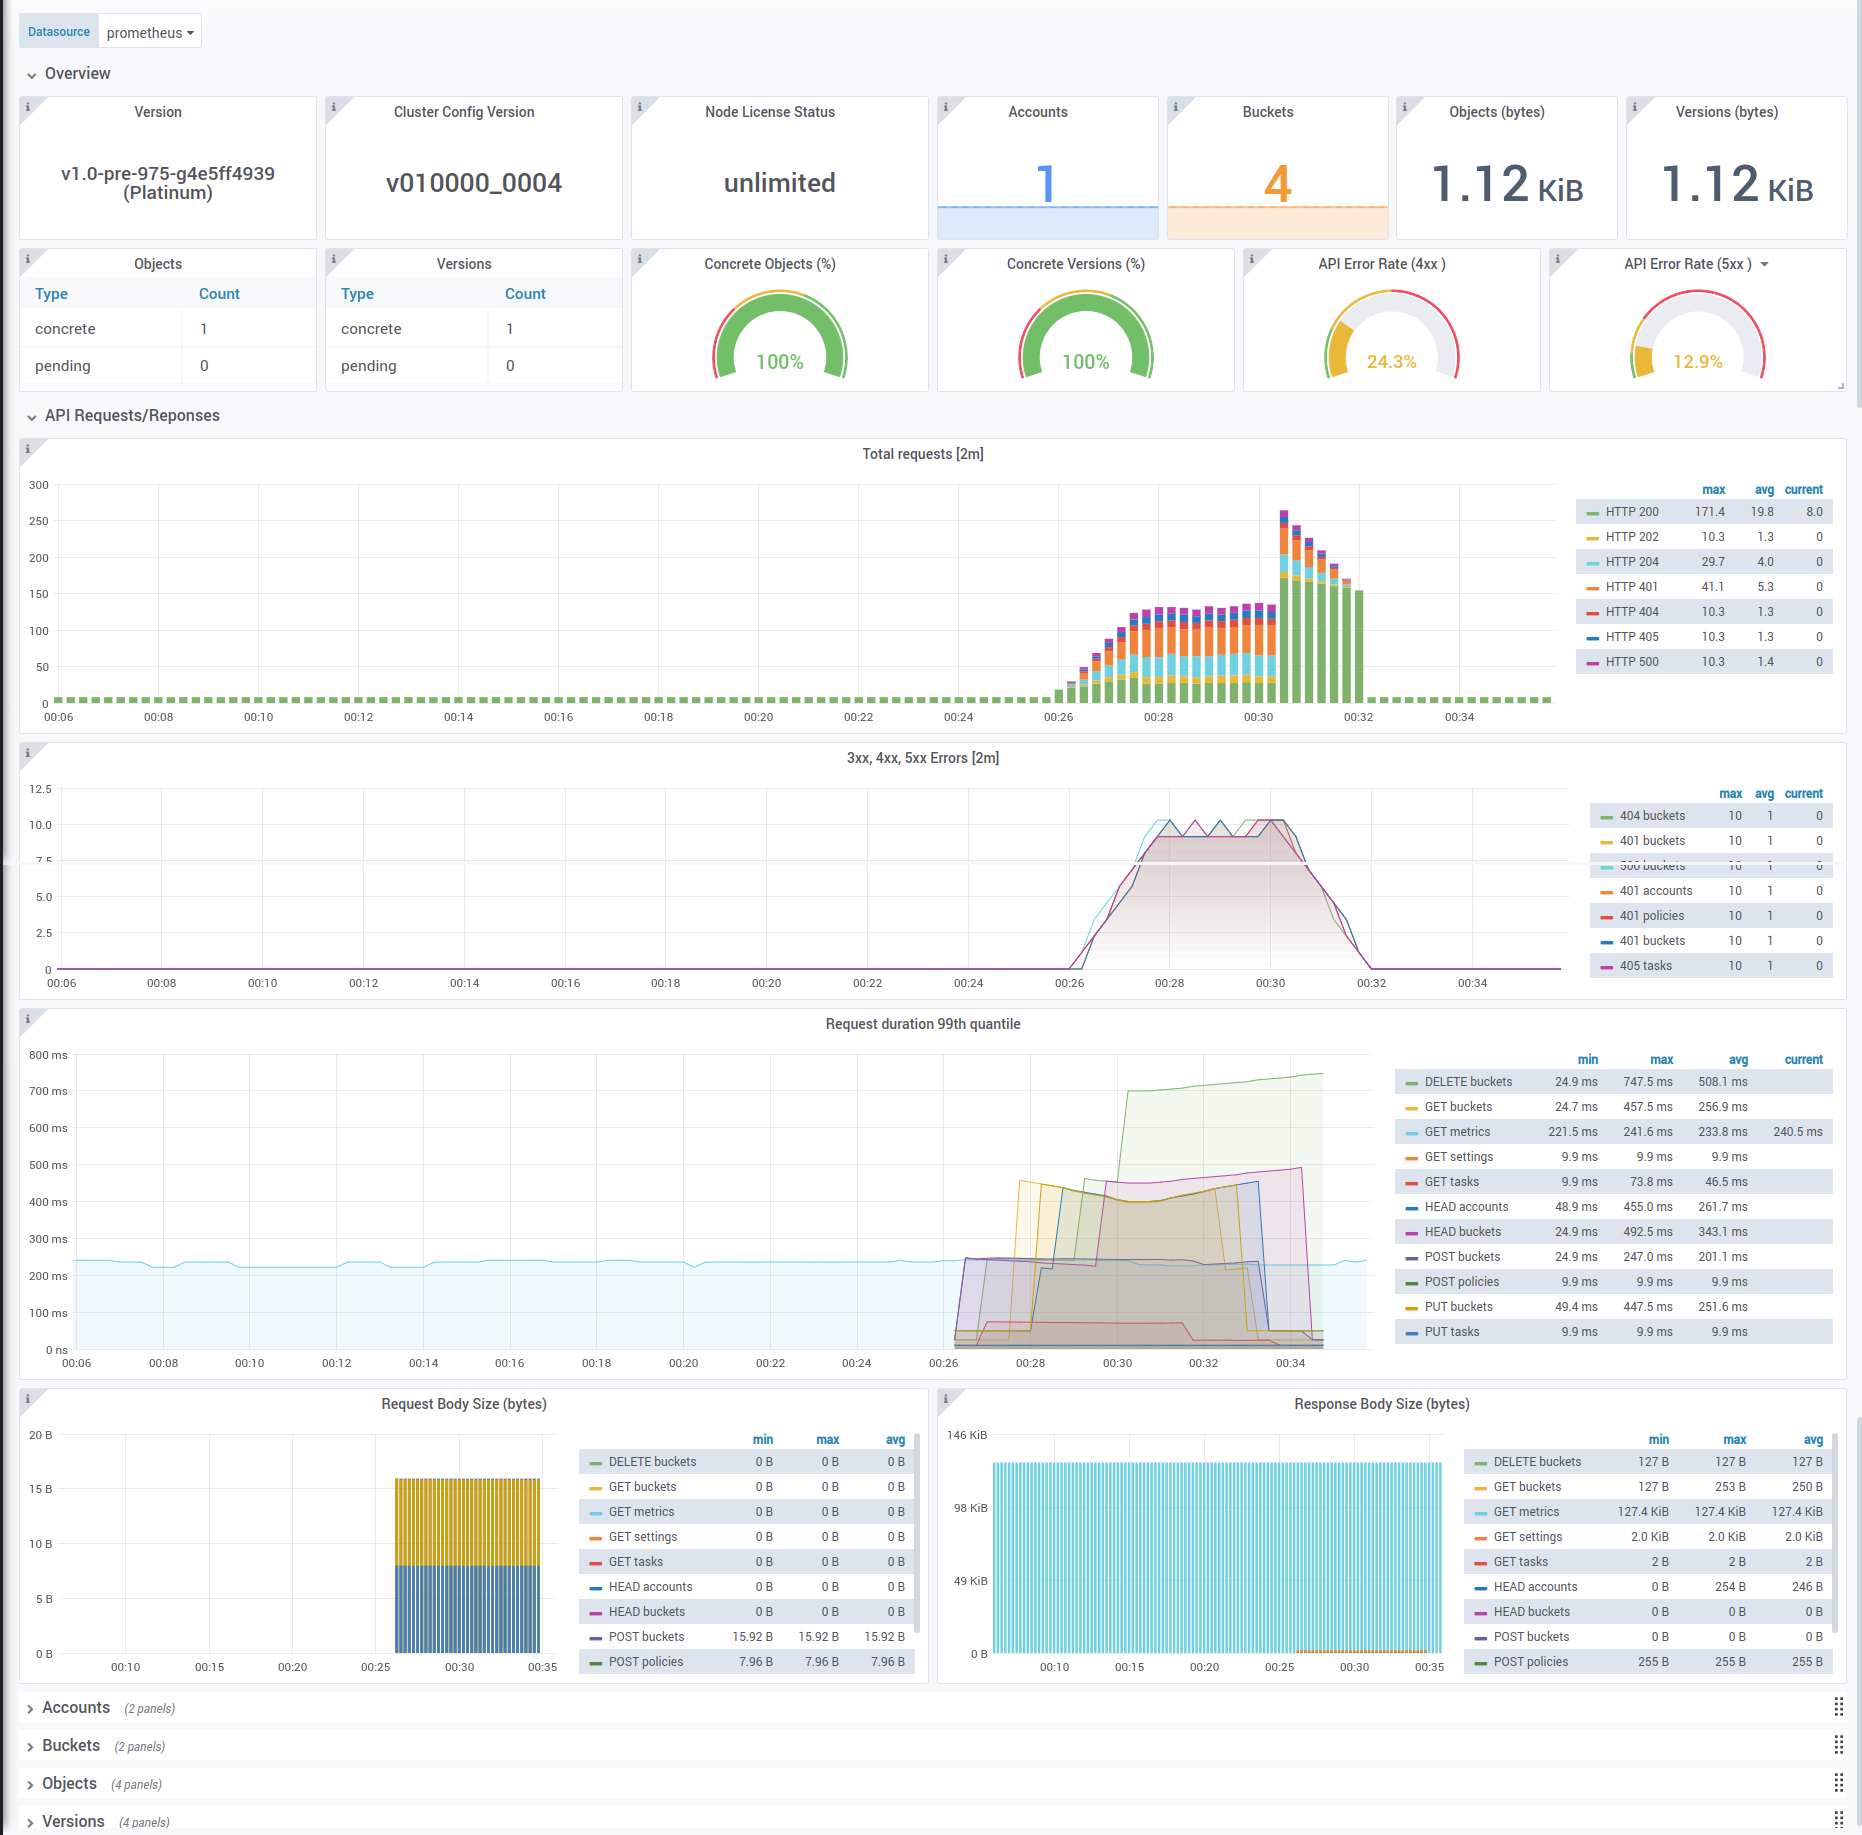
View visualizations of collected Rok metrics:
Summary
In this guide you gained insight on how the Rok Monitoring Stack integrates with Rok and which metrics it collects and visualizes.
What’s Next
To learn more about EKF and its components, check out the rest of our user guides.