
Rok Monitoring Stack UIs
This guide describes how you can access the graphical user interfaces of the Rok Monitoring Stack.
Access Prometheus UI
Prometheus provides a graphical user interface that helps users inspect metrics that are currently stored in the time-series database, run PromQL queries against the time-series database and view current configurations, rules and state of scraping targets.
Important
The Prometheus UI is not exposed via Arrikto EKF’s Istio. We strongly
suggest that you use kubectl port-forward to access the Prometheus UI
only in development environments.
Forward traffic from your localhost to
rok-tools. Choose one of the following options based on how you created your management environment:Forward traffic from your management environment to Prometheus running in your Kubernetes cluster:
root@rok-tools:~# kubectl port-forward --address 0.0.0.0 -n monitoring svc/prometheus-k8s 8080:9090Forward traffic from your local machine to Prometheus running in your Kubernetes cluster:
user@workstation:~# kubectl port-forward --address 0.0.0.0 svc/rok-tools 9090:8080
Forward traffic from your management environment to Prometheus running in your Kubernetes cluster:
root@rok-tools:~# kubectl port-forward --address 0.0.0.0 -n monitoring svc/prometheus-k8s 9090:9090
Forward traffic from your management environment to Prometheus running in your Kubernetes cluster:
root@rok-tools:~# kubectl port-forward --address 0.0.0.0 -n monitoring svc/prometheus-k8s 9090:9090
Open your browser at
localhost:9090and view the Prometheus UI.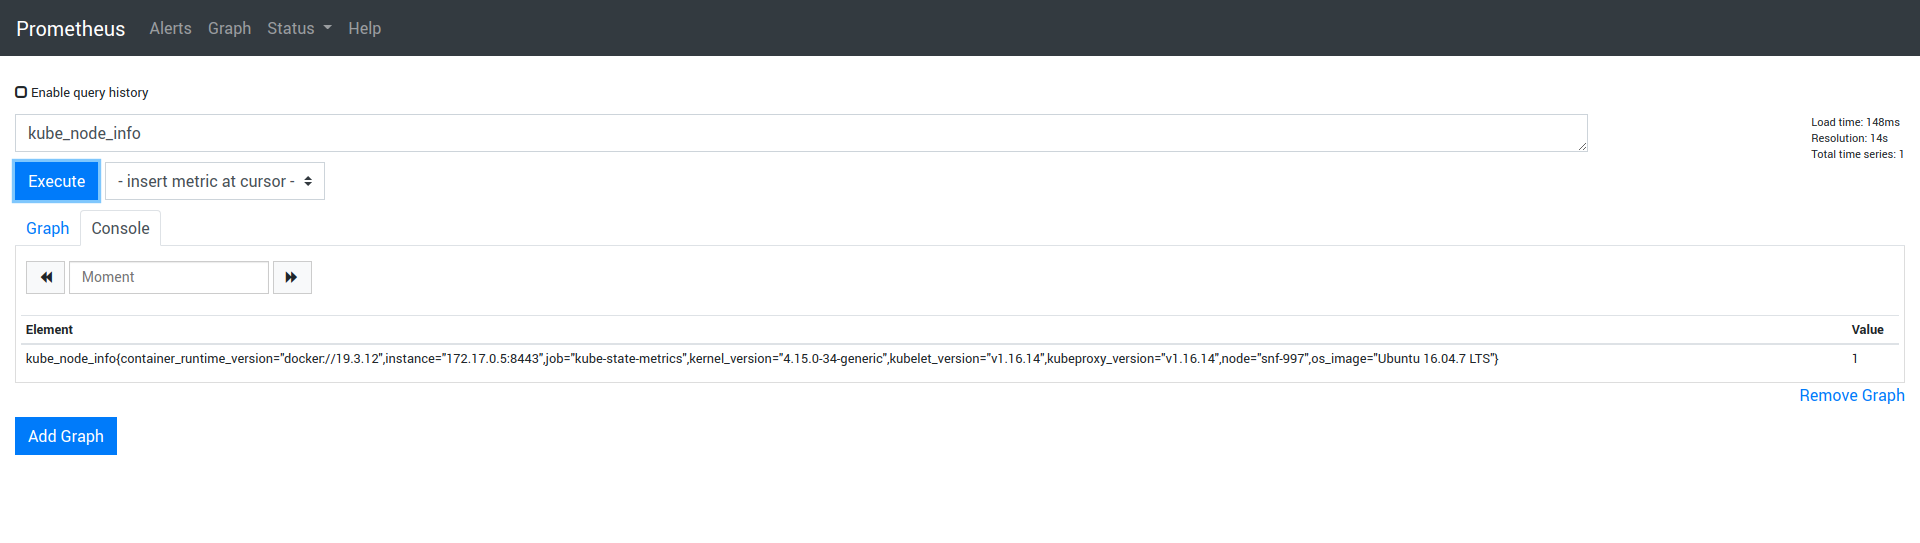
Access Grafana UI
Grafana offers a rich web UI that, depending on the privileges of the logged in user, allows one to view or create dashboards with metrics retrieved from different data sources, set up alert rules, manage users and teams, etc. The Rok Monitoring Stack preloads vanilla dashboards available in the kube-prometheus project, as well as custom ones that visualize metrics collected from Rok components and external services.
The Rok Monitoring Stack leverages the cluster’s service mesh, Istio, as well as the cluster’s auth proxy, AuthService, to securely expose the Grafana UI to the outer world and control access to it. More specifically, it creates the following Istio resources:
- a
VirtualServicethat is bound to the Ingress Gateway and routes traffic to Rok’s Grafana - an
AuthorizationPolicythat defines access control rules, i.e., which users are allowed to access Rok’s Grafana - an
AuthorizationPolicythat allows network traffic among workloads running in themonitoringnamespace
See also
- Arrikto EKF User Guides.
Open your browser at
https://<FQDN>/monitoring/Replace
<FQDN>with your sub-domain. For example:https://arrikto-cluster.apps.example.com/monitoring/In case you are not already logged in, you will need to authenticate via the OIDC provider of your cluster.
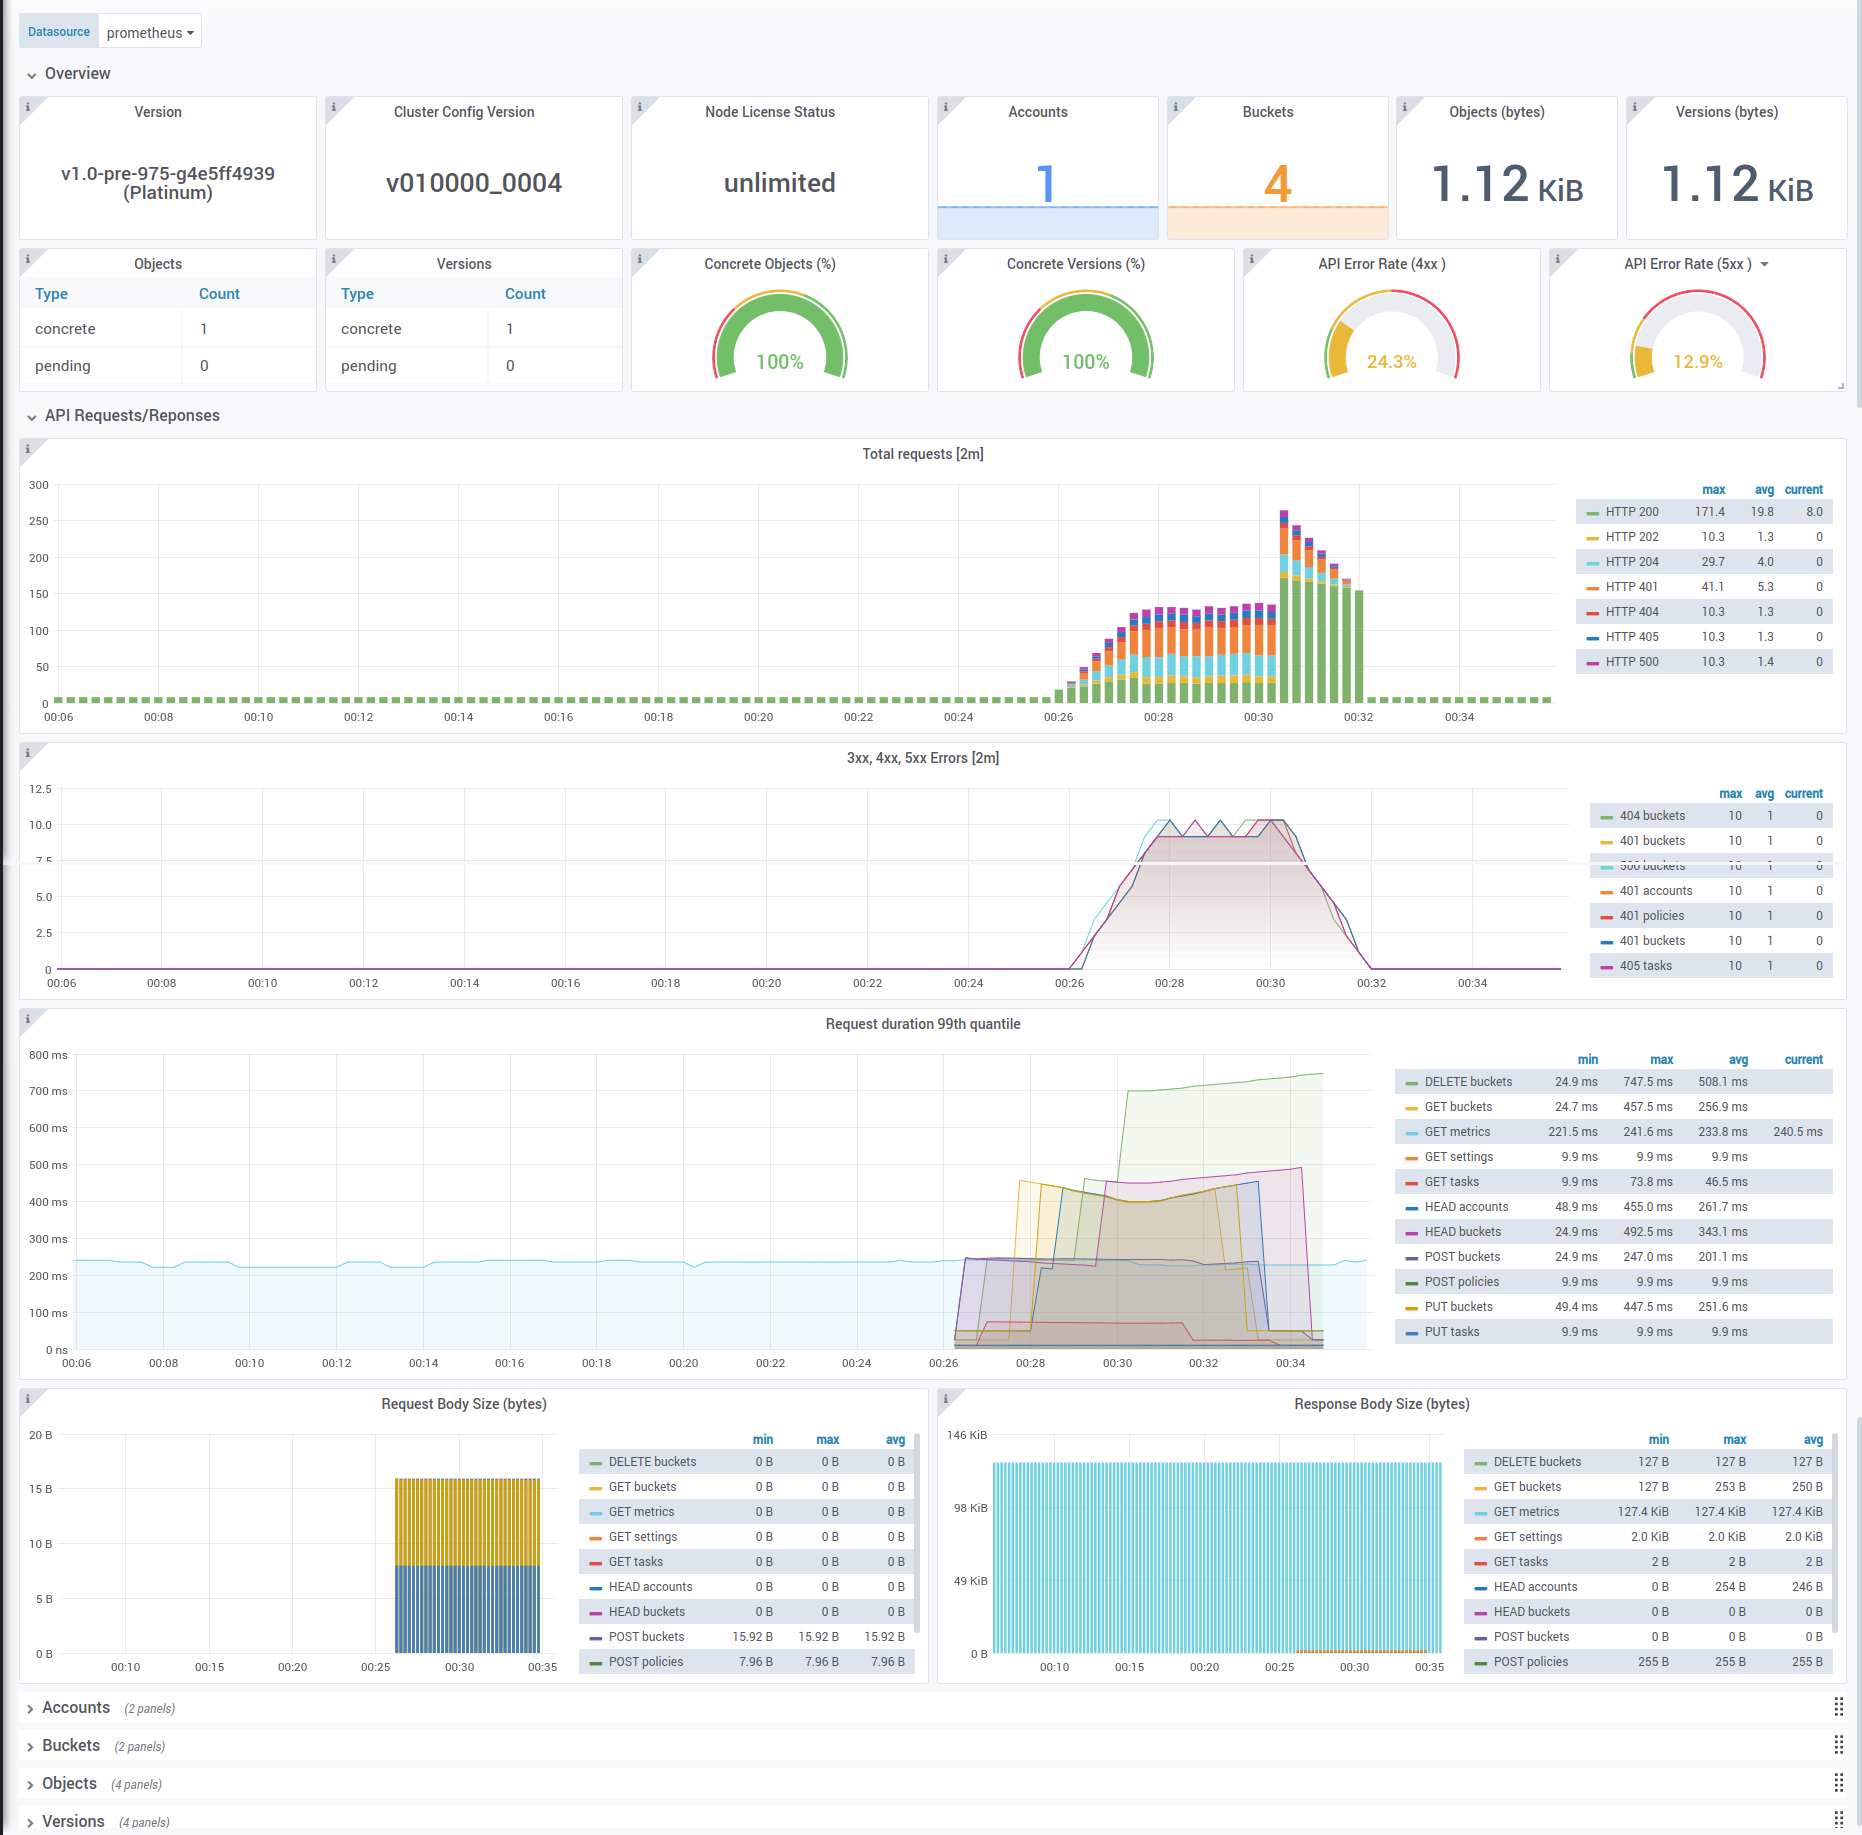
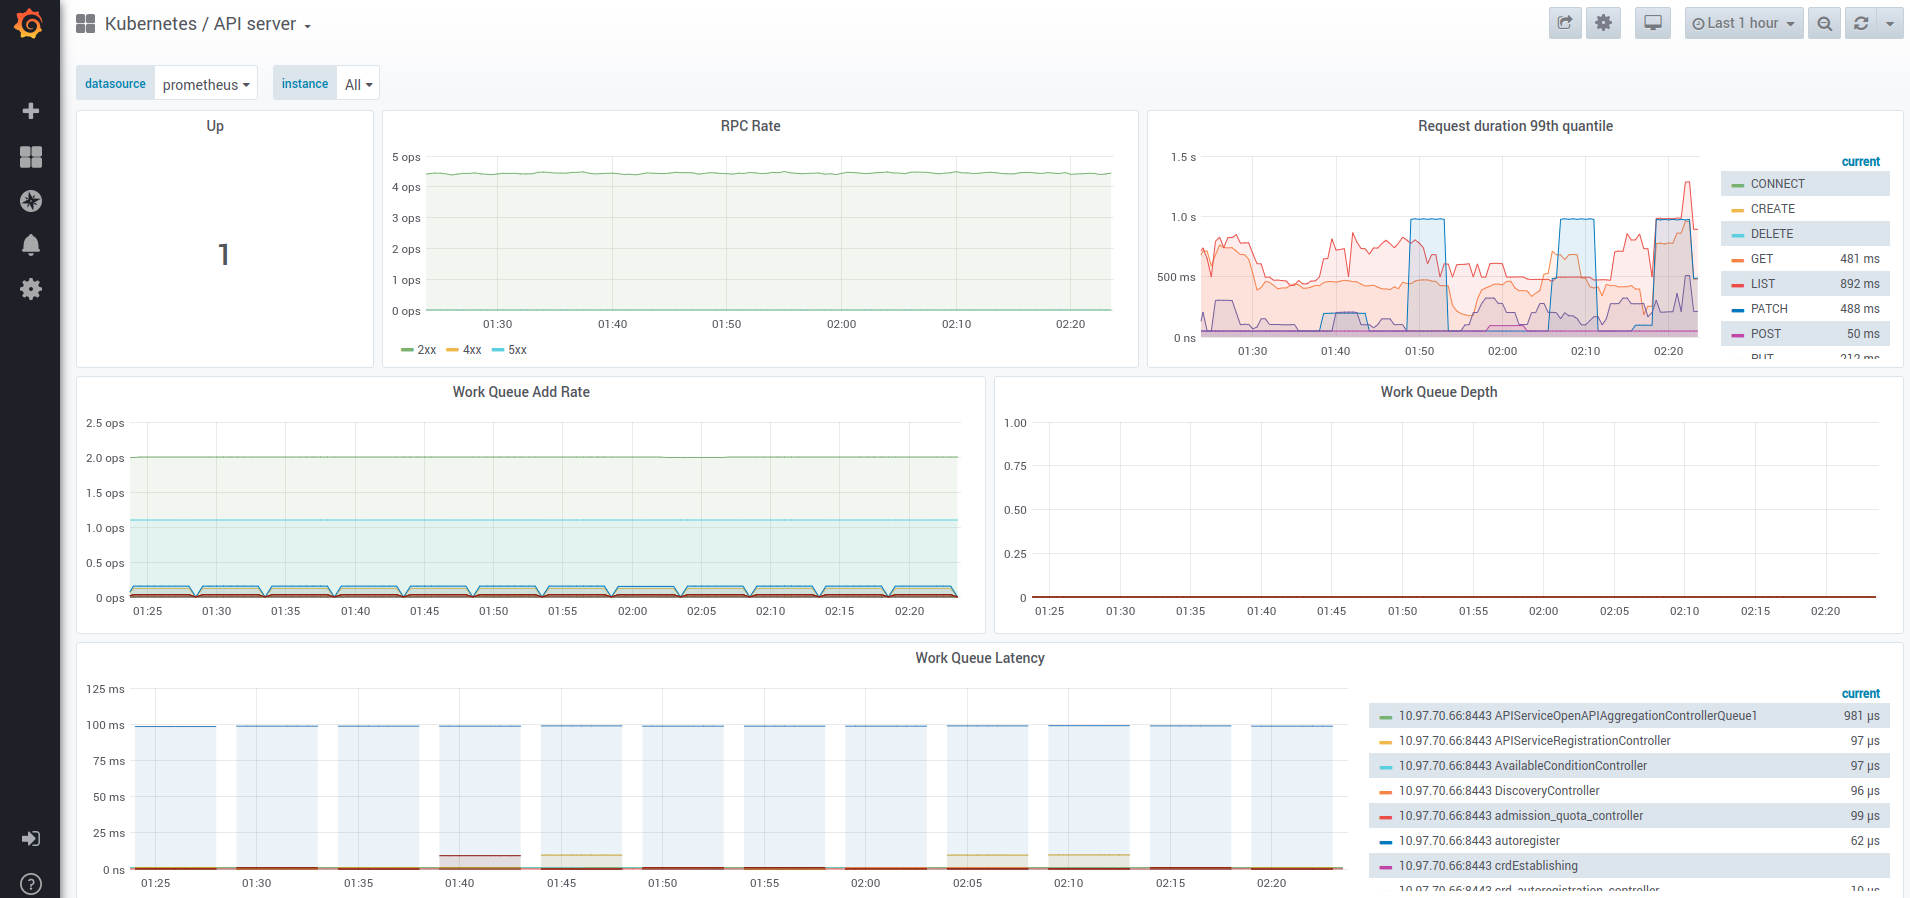
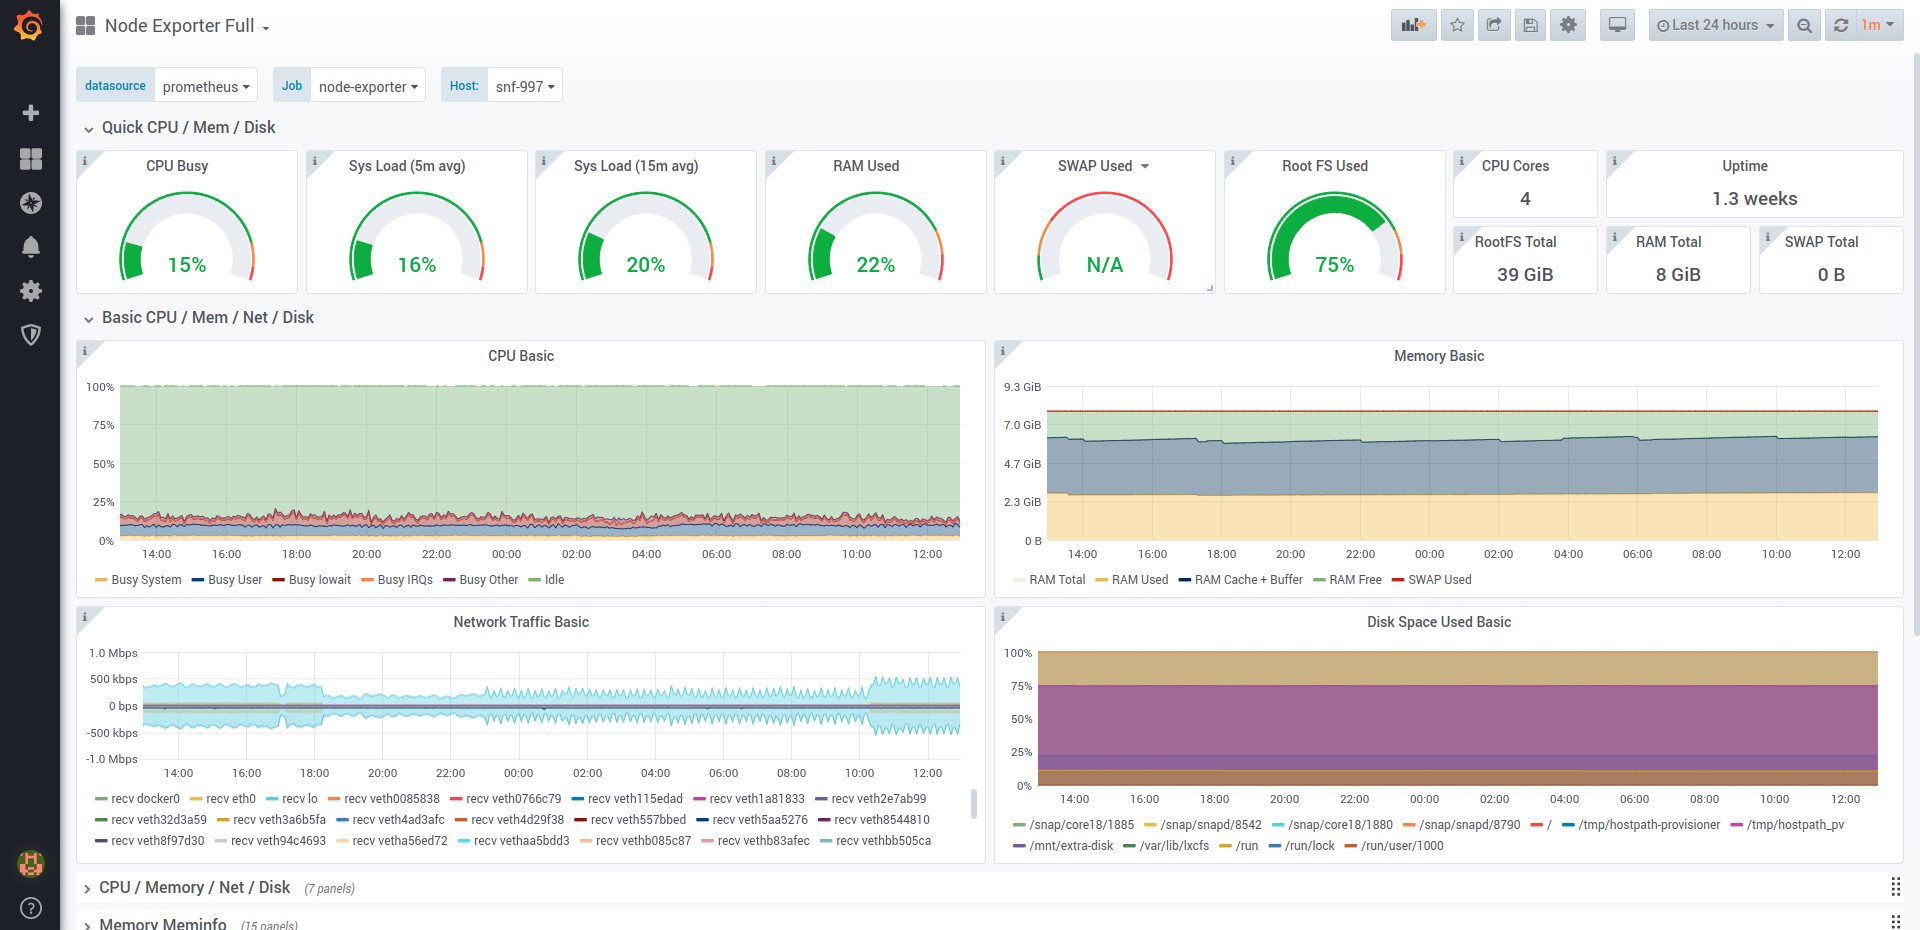
Select any of the available dashboards from the upper-left dropdown list, next to the Home button. For example, you can view the following dashboards:
- Rok:
- Kubernetes API Server:
- Node Exporter:
Note
It might take some time before metrics become available in dashboard panels. This depends on the scrape interval of each Prometheus target.
What’s Next
The next step is to learn how to monitor the physical nodes of your EKF cluster, and view the Node Exporter and Nodes Grafana dashboards.