
Performance Evaluation
This guide presents a summary for our performance evaluation. We have evaluated
the serving performance on EKF by using an example that assumes a simple
inference service with a Triton server as predictor, serving a TensorFlow model
trained with the MNIST dataset. This section considers hey as the client
that hits the inference service. Most sections refer to hey hitting the
inference service from inside the cluster, thus using the internal URL. The last
section evaluates the performance when a hey client is outside the cluster
and uses the external URL.
See also
Here is the nomenclature for technical terms introduced in this guide:
- RPS: requests per second
- LAT: p95% latency in ms
- %CPU usage: CPU usage of various components as reported by the
topcommand - clients x concurrency: load by
heyclient(s) - replicas x CPU limit: various scalable components
See also
You can perform your own evaluation and replicate our results by following the Serving Testbed guide.
Overview
Baseline
To measure the baseline performance, we created an inference service with a
single replica without the Istio sidecar, by adding the following annotation
in the istio-proxy sidecar:
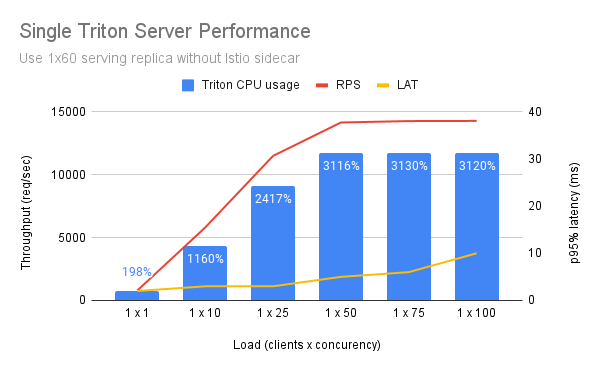
Single Triton Server
We tested this on a node with 64 CPUs and allowed Triton to use pretty much all of them:
We noticed that Triton was using only half of the available CPUs.
Multiple Triton Server per Node
We tested how Triton behaves with multiple replicas per node, aiming to fully utilize big nodes.
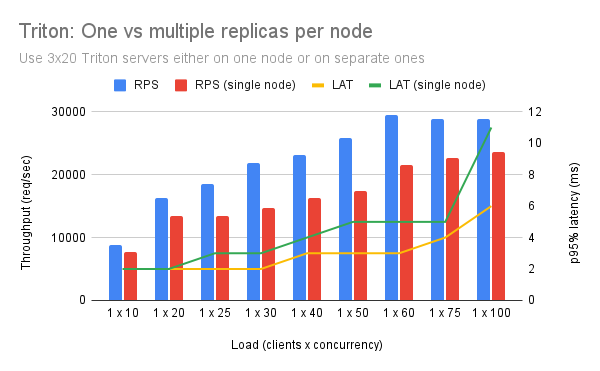
We noticed that, for more replicas, as load increases, the performance degrades. The reason for this performance degradation is process contention. This is orthogonal to the CPU limit we set. Specifically, on a 64 CPU machine, Triton will spawn 240 threads, that will all compete for a CPU share. By putting more replicas on the same node, we ended up having more context switches so the “useful” CPU usage decreased.
Conclusions
- Triton can utilize at most 32 CPUs.
- A single replica can serve up to 14K RPS.
- p95% latency is around 5-10ms.
- To avoid process contention use a single big replica per node.
Serving Overhead
This section describes the computational overhead on both default and modified configurations as compared to the above baseline.
To compare with the baseline we
- used a single serving replica with 32 CPU limit,
- used a single IGW with 12 CPU limit, and
- removed activator from the path.
Default Setup
By default istio-proxy is capped at 200% and becomes the bottleneck. As such, you cannot achieve more than 5K RPS while latency reaches 30ms.
Modified Setup and Isolated Ingress Gateway
This section represents the outcome for the performance of a single Service Pod with Serving and IGW Pods running on different nodes.
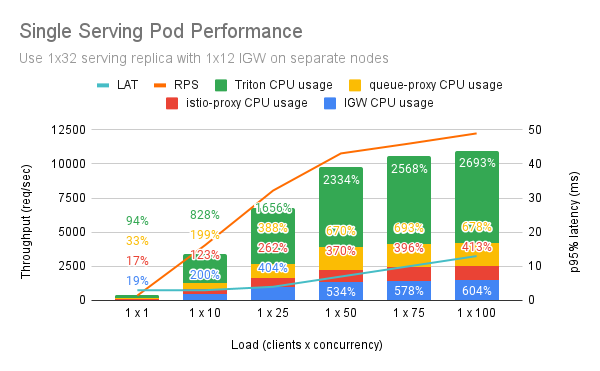
Hence, with proper configuration you can manage to reach 10K RPS with 10ms latency.
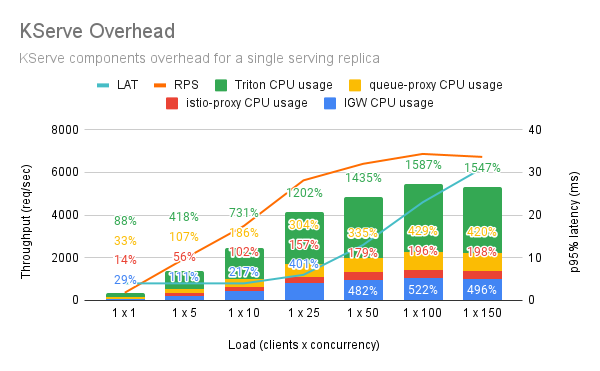
Modified Setup and Co-located Ingress Gateway
If you co-locate serving and IGW Pods, you will get less RPS with more IGW CPU usage. This is related to process contention as well, since IGW will spawn 2 x CPU threads and will compete with the ones of Triton.
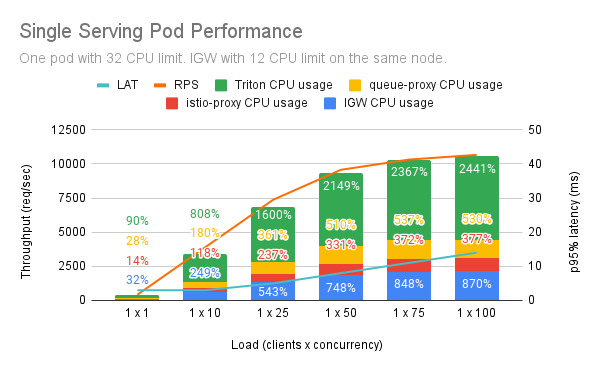
Conclusions
- Envoy proxy needs 0.35vCPU per 1000 RPS.
- The request that arrives at the istio-proxy of the serving replica goes through the IGW twice. Thus, you need approximately a twofold increase in the number of CPUs that istio-proxy sidecars consume.
- Envoy proxy adds 2.65ms to p90% latency which causes the extra latency due to the additional hops compared to the baseline. Still, you can observe acceptable latency (<10ms) even when Triton usage is approximately equal to 2200%.
- Given a Triton load, KServe adds approximately 75% CPU overhead, specifically:
- 30% for queue-proxy,
- 15% for istio-proxy, and
- 30% for IGW.
- The building blocks you can have are:
- 24 Triton + 8 queue-proxy + 4 istio-proxy + 8 IGW
- 20 Triton + 6 queue-proxy + 3 istio-proxy + 6 IGW
- 16 Triton + 4 queue-proxy + 3 istio-proxy + 6 IGW
See also
Scaling
We started with a single serving replica with 20 CPU limit, a single IGW with 8 CPU limit on a single node. We treated this as a building block. We kept adding nodes while increasing the load. We started with 1x50 load (hey clients x concurrency).
The above experiment mimics a real-world scenario where you want to saturate bigger nodes, by co-locating IGW with serving replicas. Here is the outcome.
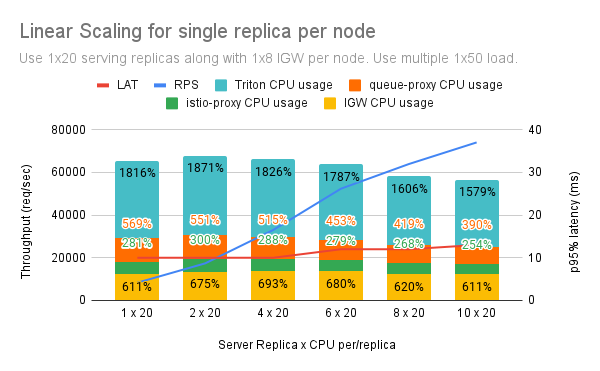
Conclusion
- In case of a single replica and 10 replicas, you can get approximately 8K and 74K RPS, respectively, while the latency remains almost stable and close to 10ms.
- Scaling follows a linear trend.
External URL
Here are some preliminary results using:
- a single serving replica with 20 CPU limit,
- an Application Load Balancer on AWS,
- default NGINX configuration,
- one public IGW with 8 CPU limit co-located with the serving Pod,
- one private IGW with 8 CPU limit co-located with the serving Pod,
- a single hey client with 50 concurrency, and
- client running inside the cluster to get comparable latency.
| Setup | RPS | LAT |
|---|---|---|
| Internal URL | 8827 | 8.6 |
| External URL without authentication caching | 996 | 55 |
| External URL with authentication caching | 6635 | 10.5 |
| External URL without authentication | 7220 | 9.3 |
Conclusion
- Without authentication caching RPS were capped at 1K and latency reached more than ~50ms.
- With authentication caching External URL performs similar to the Internal URL.
- For a single serving replica you can reach ~7K RPS with ~10ms latency.
See also
Summary
In this guide you gained insight on the performance evaluation of the EKF Serving component and how it performs better if you have modified your inference service setup properly.
What’s Next
The next step is to create a testbed if you want to reproduce the performance measurements yourself.