
Etcd Monitoring
Learning how to monitor etcd is of vital importance when running Arrikto EKF in production. Monitoring etcd lets you validate that EKF performs as expected, while it also helps you detect and troubleshoot issues in a timely manner.
Inspecting the performance and status of Rok etcd is key to keep the Rok cluster of your EKF installation healthy and functional. The Rok Monitoring Stack increases your observability into the way your Rok cluster interacts with etcd by collecting and visualizing Prometheus metrics that are directly exposed by etcd. This helps you maintain high levels of performance and availability.
This guide also contains commands that you can run to access the Rok etcd Grafana dashboard. Here is what you will need to follow them:
- An existing Kubernetes cluster.
- An existing Rok deployment.
Important
Before proceeding, ensure that you have been granted proper rights to access the Rok Monitoring Stack UI. Currently, access to the Rok Monitoring Stack is allowed only to admin users.
Introduction
etcd uses Prometheus for metrics reporting at the /metrics HTTP endpoint.
The metrics that etcd exposes can be used for real-time monitoring and
debugging. However, etcd does not persist its metrics on its own, that is,
metrics are reset upon restarts.
To persist etcd metrics on Kubernetes, the Rok Monitoring Stack creates a
ServiceMonitor custom resource in the namespace where Rok is deployed to
configure Rok Prometheus to periodically pull metrics from Rok etcd and save
them in its time-series database.
Note
By default, Rok Prometheus retains metrics for 3 days.
Metrics
Below you can view the categories of etcd v3.3 metrics:
- Stable metrics, under the
etcd_prefix. - Debugging metrics, under the
etcd_debugging_prefix. - System and Go application metrics, under the
process_andgo_and prefixes. - gRPC server metrics, under the
grpc_server_prefix.
See also
Rok Prometheus collects and stores all metrics exposed by etcd, while Rok Grafana queries for and visualizes a subset of the collected metrics. The goal is to use collected metrics to sufficiently monitor the following areas:
- leader election
- disk operations
- CPU usage
- memory usage
- network traffic
The table below lists the etcd metrics that are included in the Rok / etcd
Grafana dashboard:
| Name | Description | Type |
|---|---|---|
| etcd_disk_backend_commit_duration_seconds | The latency distributions of commit called by backend. | Histogram |
| etcd_disk_wal_fsync_duration_seconds | The latency distributions of fsync called by wal. | Histogram |
| etcd_network_client_grpc_received_bytes_total | The total number of bytes received from grpc clients. | Counter |
| etcd_network_client_grpc_sent_bytes_total | The total number of bytes sent to grpc clients. | Counter |
| etcd_network_peer_received_bytes_total | The total number of bytes received from peers. | Counter |
| etcd_network_peer_sent_bytes_total | The total number of bytes sent to peers. | Counter |
| etcd_server_has_leader | Whether or not a leader exists. 1 is existence, 0 is not. | Gauge |
| etcd_server_leader_changes_seen_total | The number of leader changes seen. | Counter |
| etcd_server_proposals_applied_total | The total number of consensus proposals applied. | Gauge |
| etcd_server_proposals_committed_total | The total number of consensus proposals committed. | Gauge |
| etcd_server_proposals_failed_total | The total number of failed proposals seen. | Counter |
| etcd_server_proposals_pending | The current number of pending proposals to commit. | Gauge |
| process_resident_memory_bytes | Resident memory size in bytes. | Gauge |
| grpc_server_handled_total | Total number of RPCs completed on the server, regardless of success or failure. | Counter |
| grpc_server_started_total | Total number of RPCs started on the server. | Counter |
| etcd_debugging_mvcc_db_total_size_in_bytes | Total size of the underlying database physically allocated in bytes. | Gauge |
| etcd_debugging_snap_save_total_duration_seconds | The total latency distributions of save called by snapshot. | Histogram |
See also
View Grafana Dashboard
Note
The Rok Monitoring Stack places Grafana dashboards for individual EKF
components under the EKF folder.
Visit the Kubeflow central dashboard with your browser at
https://<FQDN>Replace
<FQDN>with your the value of your domain. For example:https://arrikto-cluster.apps.example.comIf prompted, log in using your credentials:
Select
Metricsfrom the left side bar to navigate to Grafana: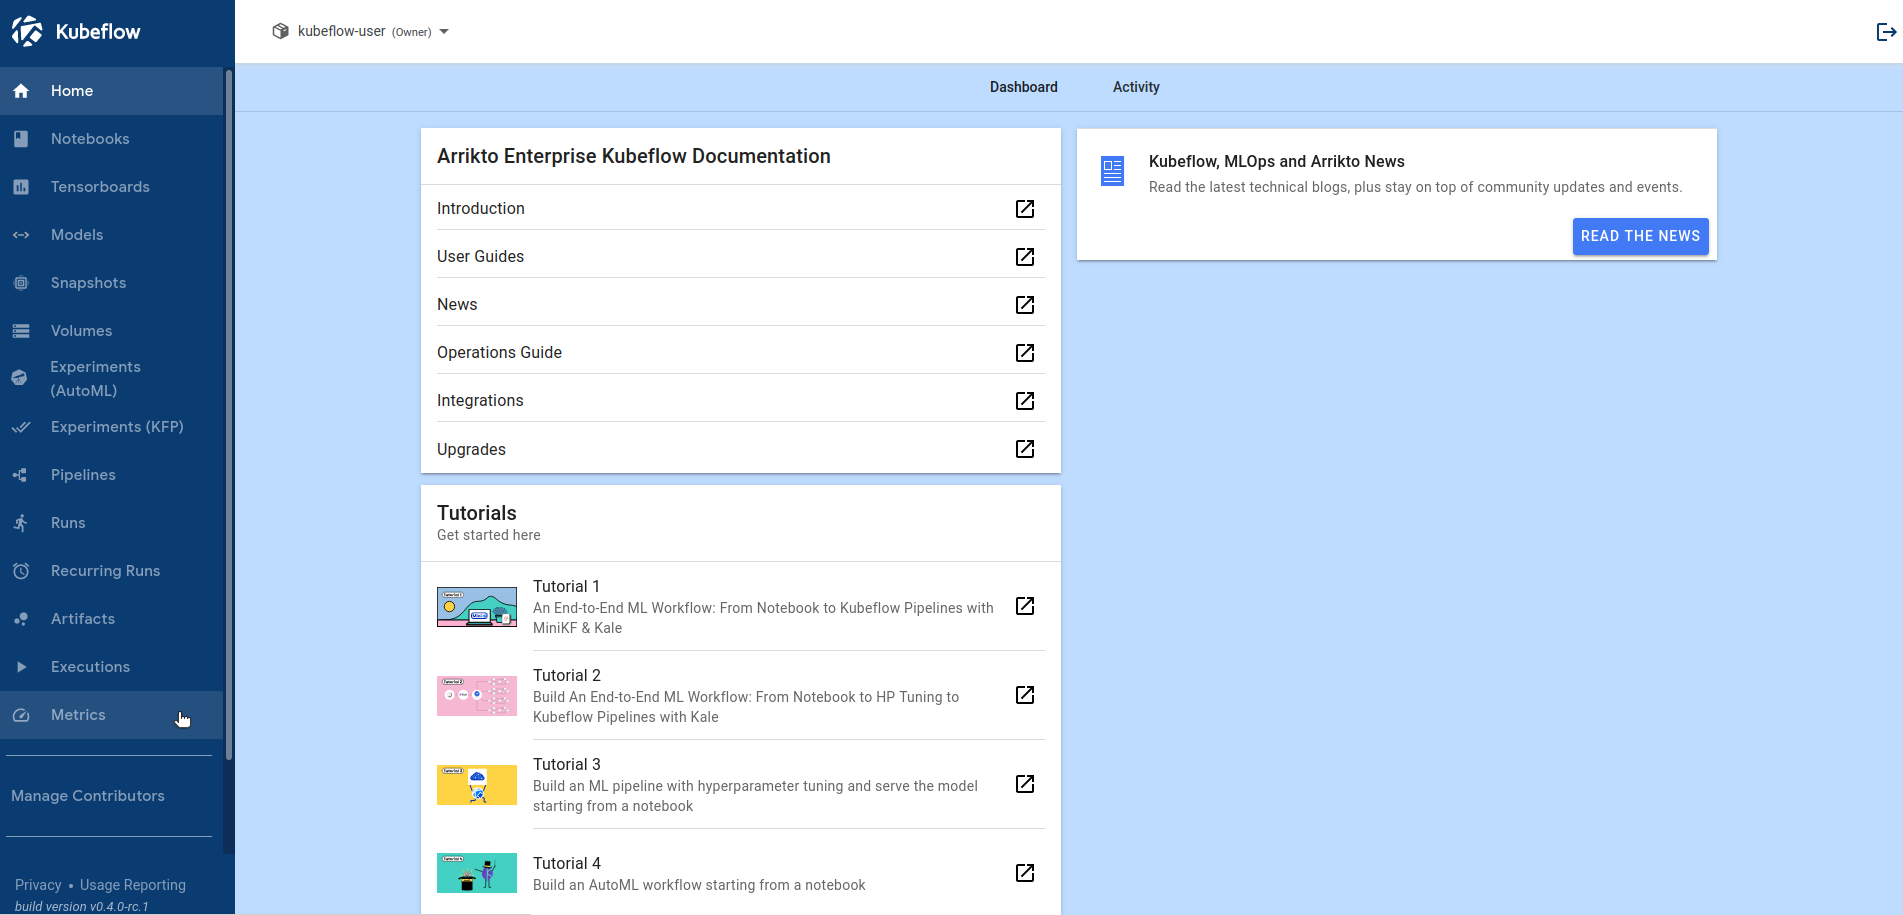
In the left side bar, hover your cursor over the
Dashboardsentry and then clickManageto navigate to the Grafana Dashboards page: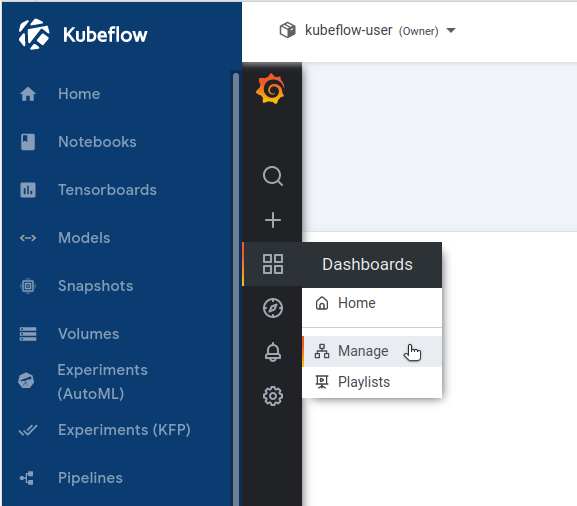
Note
In the Grafana Dashboards page you can search, view, and select dashboards.
Go to the
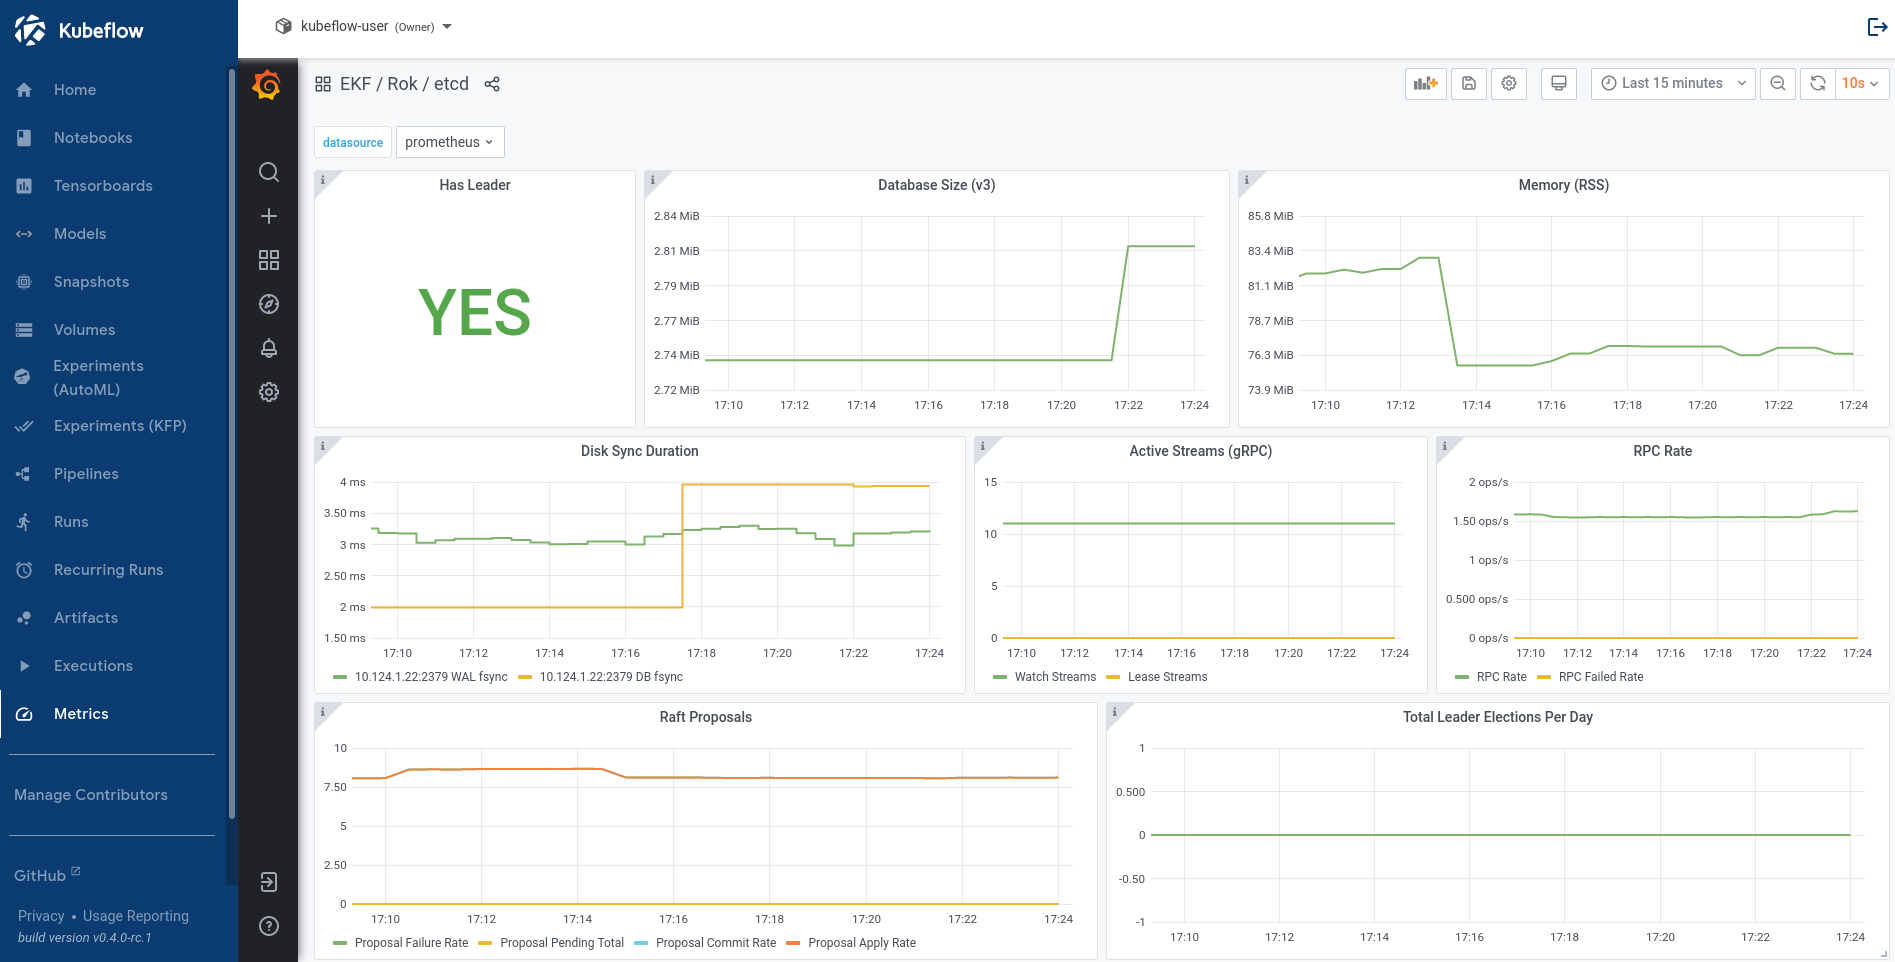
EKFfolder and select theRok / etcddashboard: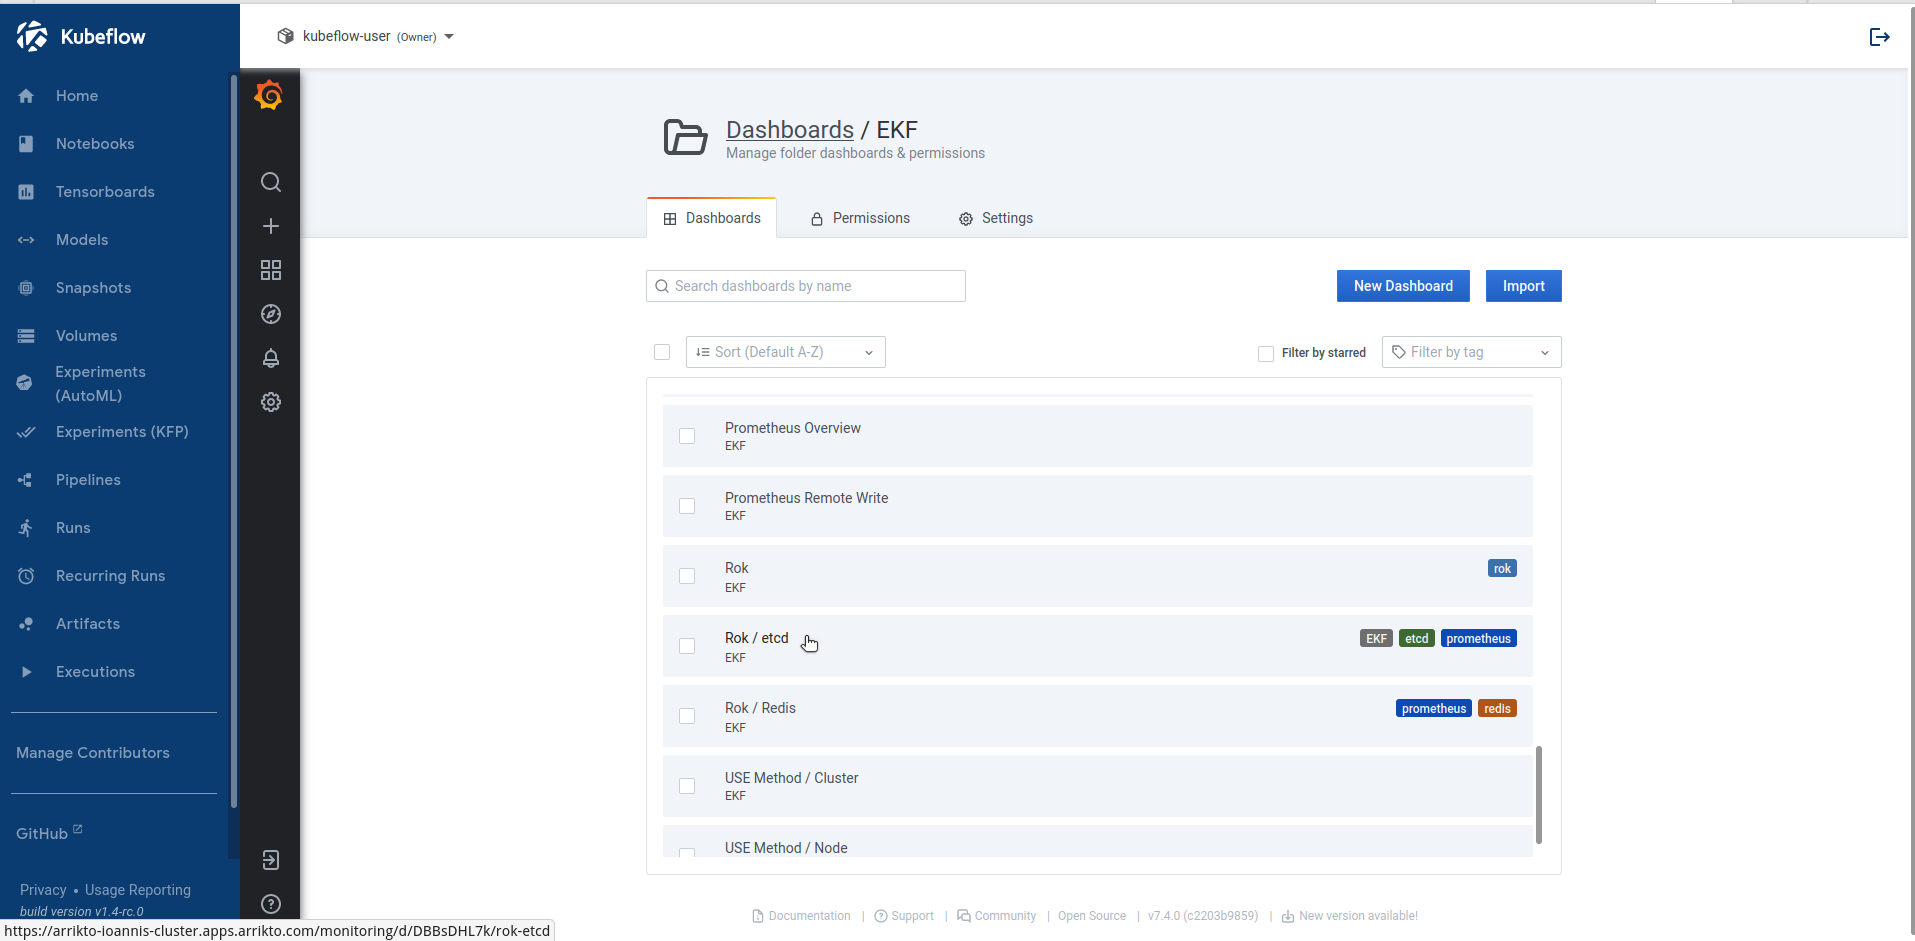
View visualizations of collected Rok etcd metrics:
Summary
In this guide you gained insight on how the Rok Monitoring Stack integrates with etcd and which metrics it collects and visualizes.
What’s Next
The next step is to learn how to monitor Rok and view the Rok Grafana dashboard.