
Rok Monitoring
To scale applications running on Kubernetes and assure Quality of Service (QoS) one needs to gain insight on how these applications behave once deployed, observe their performance at any time and detect anomalies as soon as possible.
In this direction, Rok ships with a full-fledged monitoring stack that uses Prometheus as collector and time series database and Grafana for metrics visualization and analytics. The goal of these services is to increase system observability, help users detect patterns, and facilitate debugging.
Rok Monitoring Stack is based on the open-source Kube Prometheus project and consists of the following components:
| Component | Description |
|---|---|
| Prometheus Operator | Provides Kubernetes-native deployment and management of Prometheus and related monitoring components. |
| Prometheus | An open-source monitoring system with a dimensional data model, flexible query language, efficient time series database, and modern alerting approach. |
| Node Exporter | Prometheus exporter for hardware and OS metrics exposed by *NIX kernels, written in Go with pluggable metric collectors. |
| Kube State Metrics | A simple service that listens to the Kubernetes API server and generates metrics about the state of the objects. |
| Alert Manager | A system that handles alerts sent by client applications, such as the Prometheus server, and takes care of deduplicating, grouping, and routing them to the correct receiver integrations. |
| Prometheus Adapter | A component that exposes custom, application-specific metrics via the Kubernetes Custom Metrics API, so that the HPA controller or some other entity can use them. |
| Grafana | An open-source visualization and analytics software that allows you to query, visualize, alert on, and explore metrics stored in various databases. |
See also
- Official Prometheus website.
- Official Grafana website.
- Kube Prometheus GitHub project.
Prometheus
Prometheus is a full-fledged, widely adopted monitoring system and time series database built using an HTTP pull model. It includes a dimensional data model based on labels, a custom query language named PromQL, and an alerting system called Alertmanager. Prometheus is a graduated project of the Cloud Native Computing Foundation.
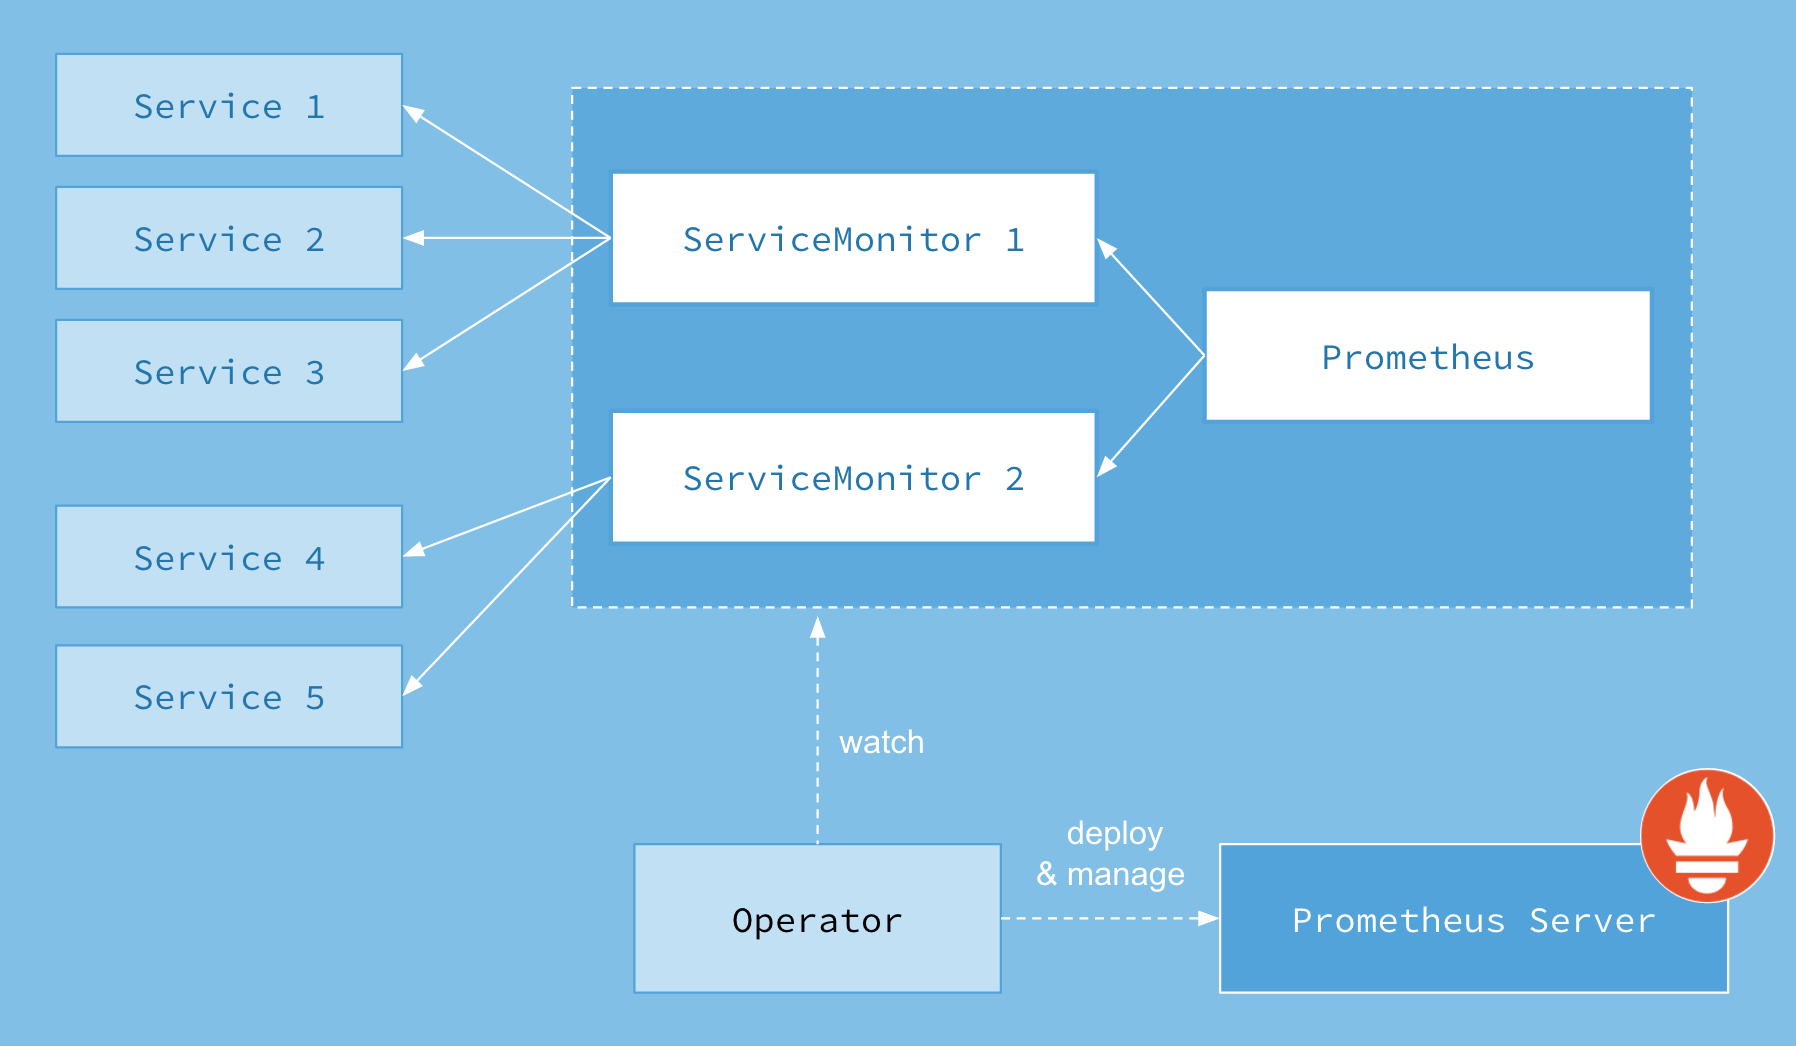
The Prometheus Operator for Kubernetes introduces the
monitoring.coreos.com/v1 API and manages the Prometheus and
ServiceMonitor custom resources. More specifically, it synchronizes the
configuration of the Prometheus server based on the spec of the Prometheus
CR and ensures that metrics from all targets referred to by existing
ServiceMonitors are collected.
Note
The monitoring stack that runs alongside Rok does not yet include Prometheus Alert Manager and Adapter. The configuration of these components depends on the needs and characteristics of each installation.
See also
- Prometheus Overview webpage.
- Prometheus time series database.
- Official documentation on the PromQL query language.
- Prometheus AlertManager alerting system.
- Prometheus Operator for Kubernetes.
Packaging
Since the deployment of Rok is leveraging Kustomize and kubectl, we maintain an opinionated collection of manifests tailored for observing Rok and its external services.
Assuming that you already have your clone of the Arrikto GitOps repository, you can view the kustomization tree with Rok's monitoring
manifests under rok/monitoring.
Rok Monitoring Targets
If you have already deployed Rok, then you have also deployed the Rok Monitoring Stack along with its other components. In this section we describe how Prometheus monitors your physical nodes, Kubernetes, and Rok's external services.
Monitor Physical Nodes
To monitor the physical nodes (or cloud VMs) that host Kubernetes and, in turn, applications running on it, we need a way to gather and export critical system metrics in order to expose the overall state regarding CPU usage, memory consumption, disk I/O, network traffic, and other resources. The standard way to achieve this in a Prometheus-based monitoring stack is to use the Prometheus Node Exporter, which runs a set of collectors for both hardware and OS metrics exposed by the kernel.
The Rok Monitoring Stack deploys Node Exporter as a DaemonSet on
Kubernetes so that it can retrieve system metrics from all nodes.
To make Prometheus aware of the Node Exporter and configure it to collect node
metrics periodically, we use a ServiceMonitor resource for the Node Exporter
service (node-exporter.monitoring) which looks like the following:

| 1 | apiVersion: monitoring.coreos.com/v1 | |
| 2 | kind: ServiceMonitor | |
| 3 | metadata: | |
| 4-24 | ||
| 4 | labels: | |
| 5 | app.kubernetes.io/name: node-exporter | |
| 6 | app.kubernetes.io/version: v1.0.1 | |
| 7 | name: node-exporter | |
| 8 | namespace: monitoring | |
| 9 | spec: | |
| 10 | endpoints: | |
| 11 | - bearerTokenFile: /var/run/secrets/kubernetes.io/serviceaccount/token | |
| 12 | interval: 15s | |
| 13 | port: https | |
| 14 | relabelings: | |
| 15 | - action: replace | |
| 16 | regex: (.*) | |
| 17 | replacement: $1 | |
| 18 | sourceLabels: | |
| 19 | - __meta_kubernetes_pod_node_name | |
| 20 | targetLabel: instance | |
| 21 | scheme: https | |
| 22 | tlsConfig: | |
| 23 | insecureSkipVerify: true | |
| 24 | jobLabel: app.kubernetes.io/name | |
| 25 | selector: | |
| 26 | matchLabels: | |
| 27 | app.kubernetes.io/name: node-exporter |
See also
Monitor Kubernetes
To monitor Kubernetes we need a way to gather and export metrics from core
Kubernetes components, such as the API server, kubelet, scheduler,
controller-manager, coreDNS, etc. These components already collect and expose
metrics in the Prometheus data format via a Kubernetes Service.
Note
cAdvisor is an open-source agent that is integrated into the kubelet binary that monitors resource usage and analyzes the performance of containers. It collects statistics about the CPU, memory, file, and network usage for all containers running on a given node (it does not operate at the pod level).
In addition, we need to gather and export metrics from Kubernetes resources,
such as StatefulSets, DaemonSets, PersistentVolumeClaims. The
standard way to achieve this in a Prometheus-based monitoring stack is to
deploy kube-state-metrics
in the Kubernetes cluster to be monitored. Kube state metrics focuses on
generating completely new metrics from Kubernetes object state. It holds an
entire snapshot of Kubernetes state in memory and continuously generates new
metrics based on it.
To this end, to make Prometheus aware of Kubernetes metrics (both from core
components and resources) the Rok Monitoring Stack creates a ServiceMonitor
resource for each Service that exposes metrics to be collected.
You can view all ServiceMonitor resources by running the following command:
root@rok-tools:~# kubectl get servicemonitor --all-namespaces
NAMESPACE    NAME
monitoring   coredns
monitoring   kube-apiserver
monitoring   kube-controller-manager
monitoring   kube-scheduler
monitoring   kube-state-metrics
monitoring   kubelet
Monitor Rok External Services
Rok depends on external services to operate. Namely, it leverages
To allow Prometheus to monitor these services, that is, scrape respective
targets to collect exported metrics periodically, the Rok Monitoring Stack
creates proper RBAC resources so that Prometheus is allowed to get,
list, and watch Pods, Services, and Endpoints in the namespace where Rok
is deployed.
Monitor Etcd
To make Prometheus aware of the Rok etcd and configure it to scrape metrics
periodically, the Rok Monitoring Stack creates a ServiceMonitor resource for
the Rok etcd service (rok-etcd.rok).
| 1 | # This file is part of Rok. | |
| 2 | # | |
| 3 | # Copyright © 2020 Arrikto Inc. All Rights Reserved. | |
| 4-17 | ||
| 4 | ||
| 5 | apiVersion: monitoring.coreos.com/v1 | |
| 6 | kind: ServiceMonitor | |
| 7 | metadata: | |
| 8 | name: rok-etcd-metrics | |
| 9 | namespace: rok | |
| 10 | spec: | |
| 11 | endpoints: | |
| 12 | - interval: 15s | |
| 13 | port: client | |
| 14 | namespaceSelector: | |
| 15 | matchNames: | |
| 16 | - rok | |
| 17 | selector: | |
| 18 | matchLabels: | |
| 19 | app: etcd | |
| 20 | app.kubernetes.io/part-of: rok |
Monitor Redis
To make Prometheus aware of the Rok Redis and configure it to scrape metrics
periodically, the Rok Monitoring Stack creates a ServiceMonitor resource for
Rok's Redis metrics service (rok-redis-metrics.rok).
| 1 | # This file is part of Rok. | |
| 2 | # | |
| 3 | # Copyright © 2020 Arrikto Inc. All Rights Reserved. | |
| 4-17 | ||
| 4 | ||
| 5 | apiVersion: monitoring.coreos.com/v1 | |
| 6 | kind: ServiceMonitor | |
| 7 | metadata: | |
| 8 | name: rok-redis-metrics | |
| 9 | namespace: rok | |
| 10 | spec: | |
| 11 | endpoints: | |
| 12 | - interval: 15s | |
| 13 | port: metrics | |
| 14 | namespaceSelector: | |
| 15 | matchNames: | |
| 16 | - rok | |
| 17 | selector: | |
| 18 | matchLabels: | |
| 19 | app: redis | |
| 20 | app.kubernetes.io/part-of: rok |
Monitor Istio
The integration of Istio with Prometheus is a work in progress.
Rok Integration
Rok is natively integrated with Prometheus, that is, it serves the /metrics
endpoint to expose metrics to the outer world, including the Prometheus server
that scrapes this target periodically.
At the moment, Rok exposes the following aggregated, application-level metrics through its API:
| Rok Metric | Prometheus Metric |
|---|---|
| Software info (version, cluster config) | Gauge |
| Number of accounts | Gauge |
| Number of buckets, across all accounts | Gauge |
| Number of objects, across all accounts and buckets | Gauge |
| Number of versions, across all accounts, buckets and objects | Gauge |
| Size of objects, across all accounts and buckets | Gauge |
| Size of versions, across all accounts, buckets and objects | Gauge |
| Number of HTTP requests | Counter |
| Number of HTTP responses | Counter |
| Request duration | Histogram |
| Request body size | Histogram |
| Response body size | Histogram |
View Dashboards
In this section we describe how you can view the metrics that the Rok Monitoring Stack collects, as well as Prometheus configurations and rules.
View Prometheus UI
Prometheus offers a web UI that enables you to view simple graphs, Prometheus configuration and rules, as well as the state of the monitoring endpoints.
Forward traffic from your local machine to Prometheus running in your Kubernetes cluster:
root@rok-tools:~# kubectl port-forward --address 0.0.0.0 -n monitoring svc/prometheus-k8s 8080:9090
Forward traffic from your localhost to
rok-tools. Choose one of the following options based on how you created your management environment:user@workstation:~# kubectl port-forward svc/rok-tools 9090:8080
Skip to the next step.
Skip to the next step.
Open your browser at
localhost:9090and view the Prometheus UI.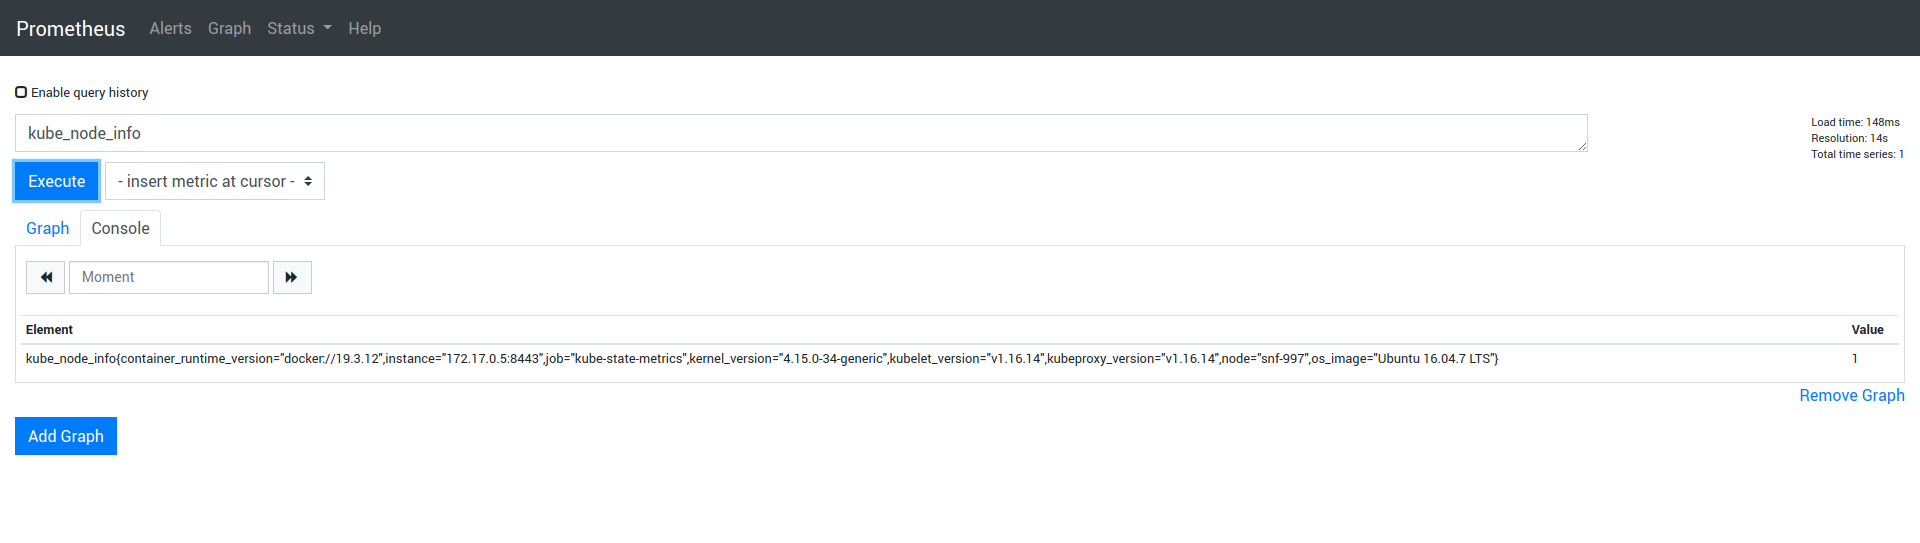
View Grafana UI
Grafana offers a rich web UI that allows you to view or create dashboards with metrics retrieved from a multitude of datasources, set up alert rules, and perform other actions. The monitoring stack that accompanies Rok ships with certain dashboards that are pre-loaded and available upon deployment.
Forward traffic from your local machine to Grafana running in your Kubernetes cluster:
root@rok-tools:/# kubectl port-forward --address 0.0.0.0 -n monitoring svc/grafana 8080:3000
Forward traffic from your localhost to
rok-tools. Choose one of the following options based on how you created your management environment:user@workstation:~# kubectl port-forward svc/rok-tools 3000:8080
Skip to the next step.
Skip to the next step.
Open your browser at
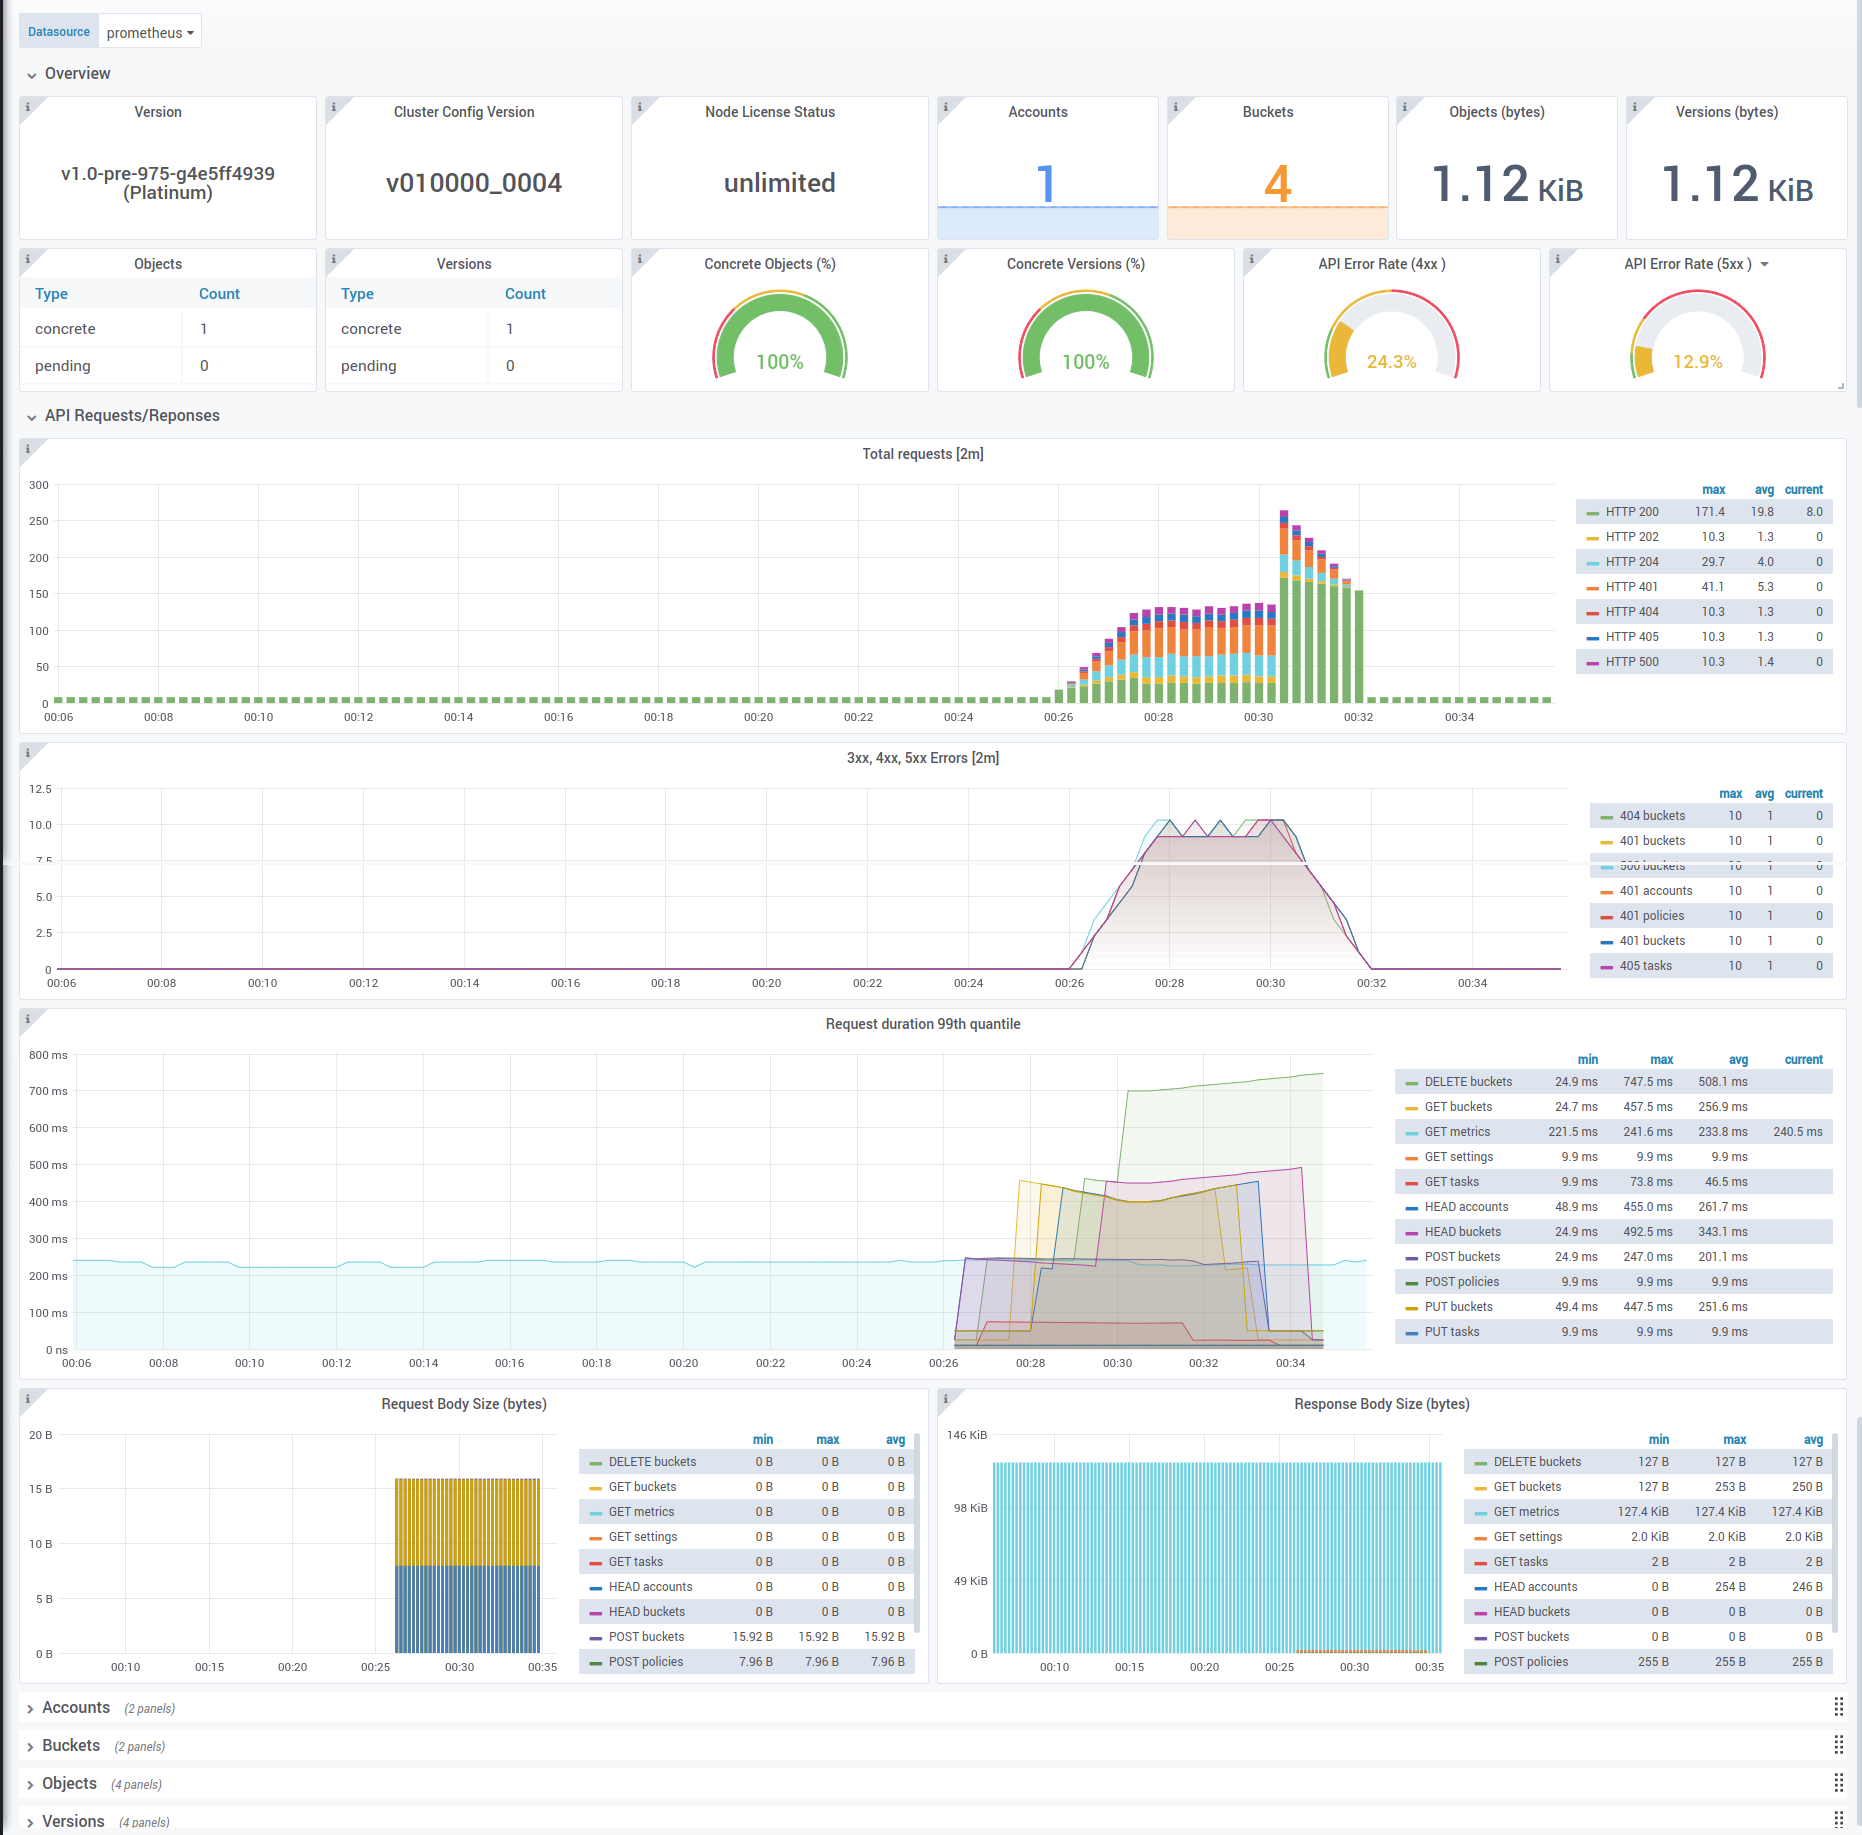
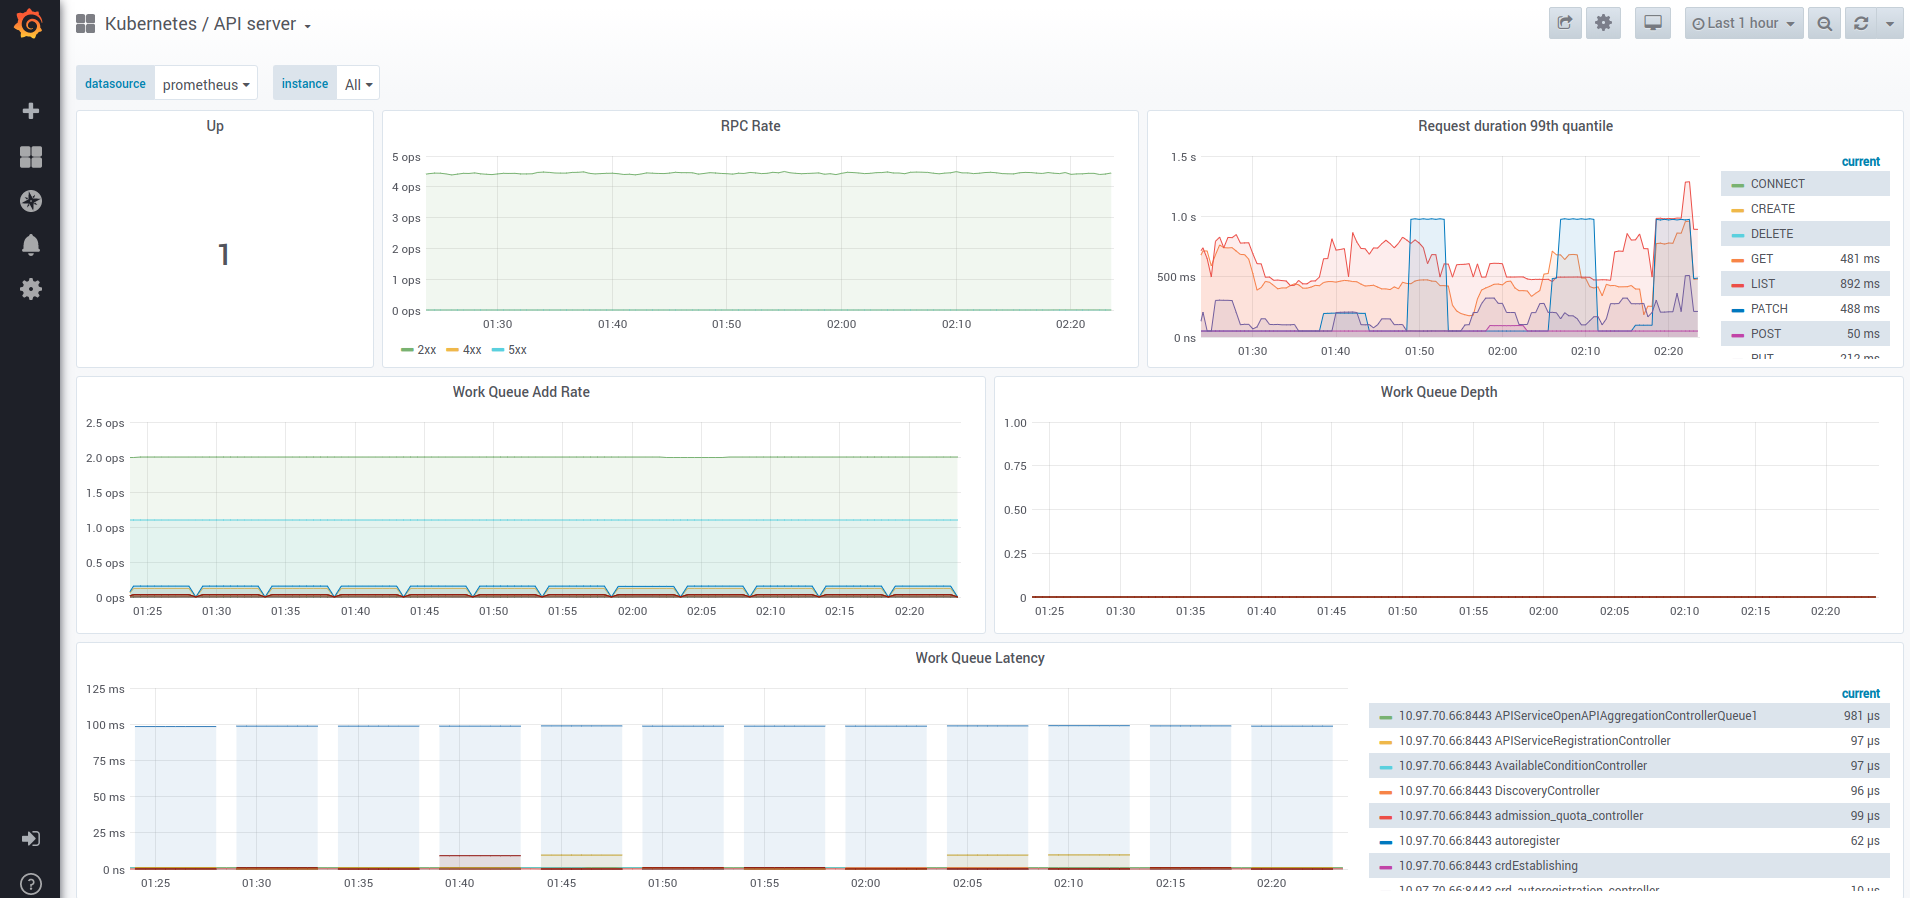
localhost:3000and view the Grafana UI.Select any of the available dashboards from the upper-left dropdown list, next to the Home button. For example, you can view the following dashboards:
- Rok:
- Kubernetes API Server:
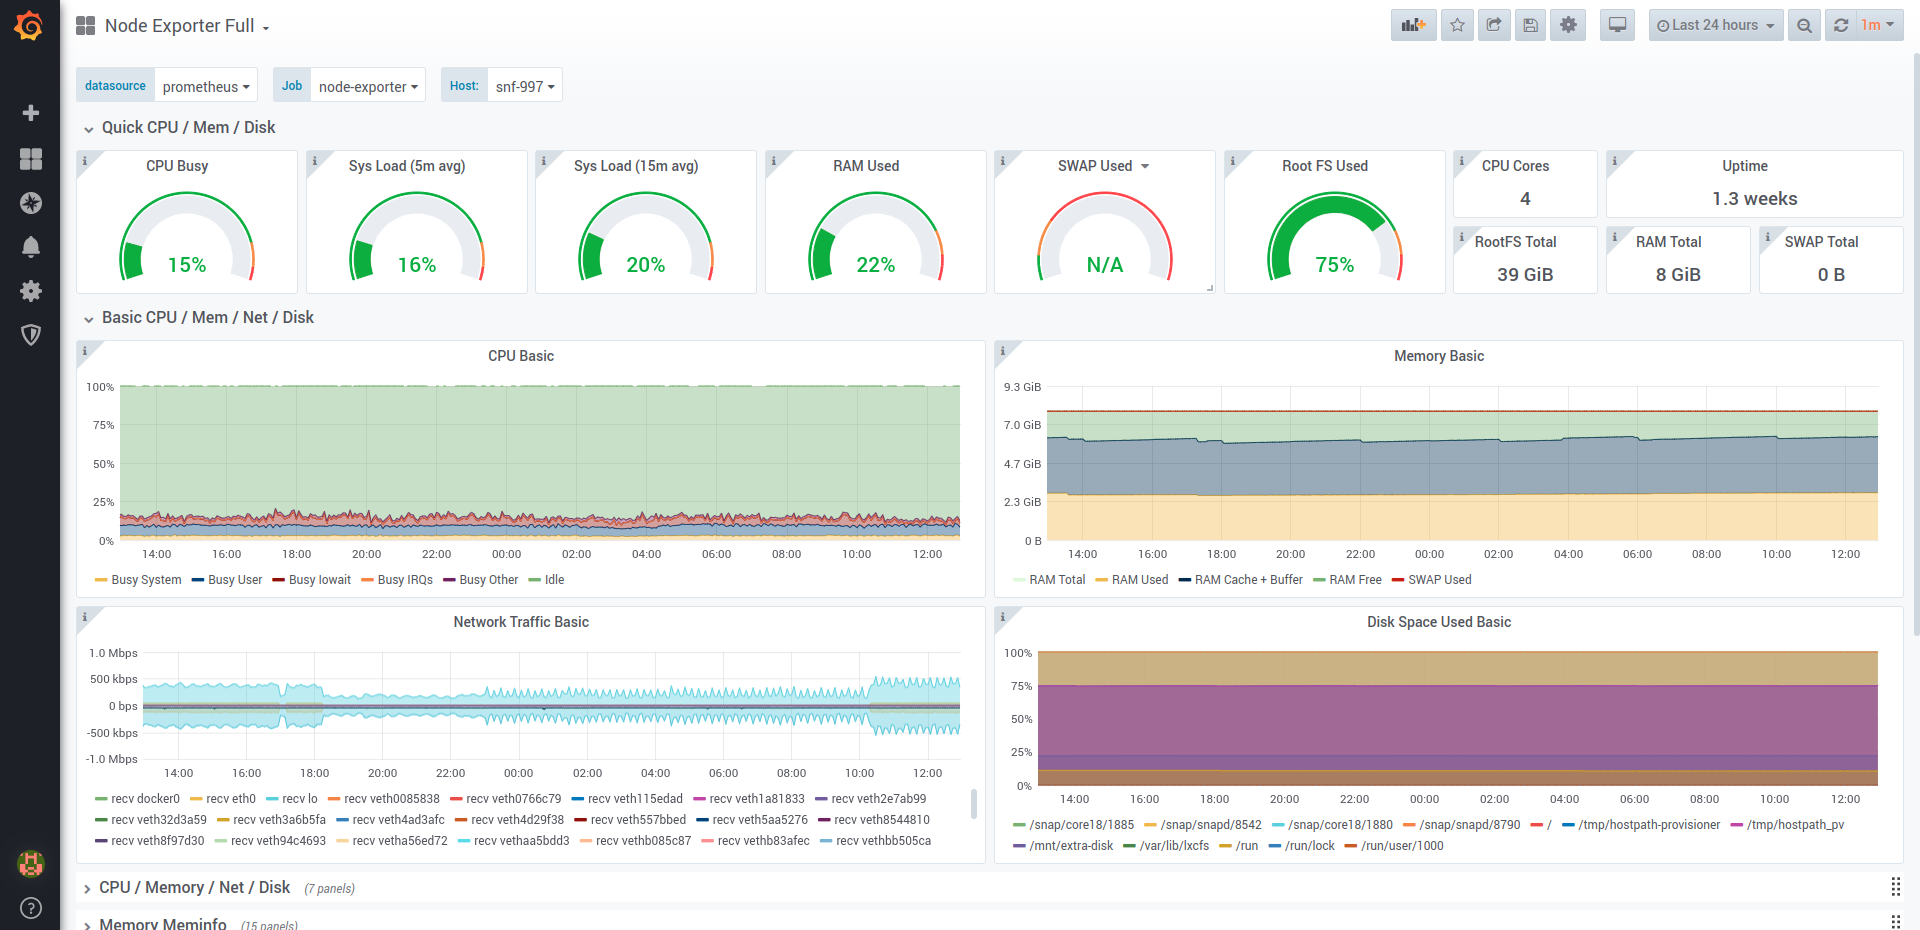
- Node Exporter:
Note
It might take some time before metrics become available in dashboard panels. This depends on the scrape interval of each Prometheus target.