
Rok Monitoring Stack Architecture
This guide contains information about the architecture of the Rok Monitoring Stack.
Introduction
The Rok Monitoring Stack (RMS) is a carefully curated collection of Kubernetes manifests, Grafana dashobards and Prometheus rules to operate end-to-end EKF cluster monitoring. RMS is a Prometheus-based monitoring stack that is built on top of the widely adopted, open-source kube-prometheus repository.
To configure and deploy RMS in a declarative manner based on GitOps, Arrikto organizes the kube-prometheus manifests into Kustomize packages. By applying Kustomize patches, we selectively configure components and tailor RMS to monitor physical nodes, Kubernetes, Rok external services and Rok.
Assuming that you already have your clone of the Arrikto GitOps
repository, you can view the kustomization tree with the
Rok monitoring manifests under rok/monitoring/.
Note
Currently, RMS follows release-0.7 of kube-prometheus that is compatible
with Kubernetes 1.19 and 1.20.
See also
Components
The Rok Monitoring Stack consists of multiple components, each responsible for specific operations. In the table below you can view the components that RMS configures and deploys by default:
| Component | Description |
|---|---|
| Prometheus Operator | Provides Kubernetes-native deployment and management of Prometheus and related monitoring components. |
| Prometheus | An open-source monitoring system with a dimensional data model, flexible query language, efficient time series database, and modern alerting approach. |
| Node Exporter | Prometheus exporter for hardware and OS metrics exposed by *NIX kernels, written in Go with pluggable metric collectors. |
| Kube State Metrics | A simple service that listens to the Kubernetes API server and generates metrics about the state of the objects. |
| Grafana | An open-source visualization and analytics software that allows you to query, visualize, alert on, and explore metrics stored in various databases. |
The core of the Rok Monitoring Stack is Prometheus: a full-fledged, widely adopted monitoring system and time series database built using an HTTP pull model. It includes a dimensional data model based on labels, a custom query language (PromQL), and an alerting system (Alert Manager). Prometheus is a graduated project of the Cloud Native Computing Foundation.
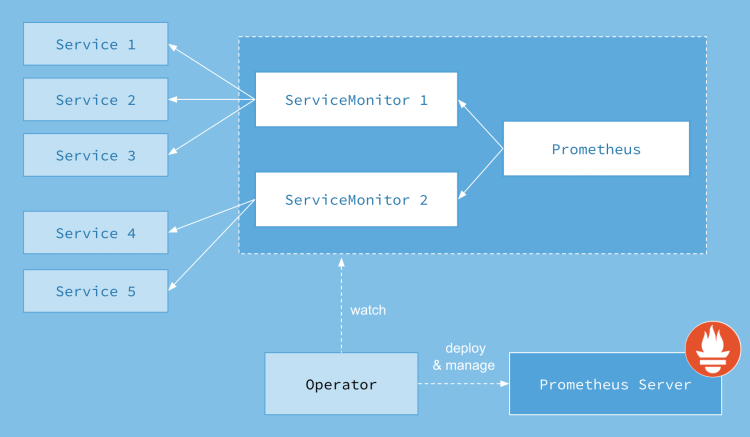
The Prometheus Operator for Kubernetes introduces the
monitoring.coreos.com/v1 API and manages the Prometheus,
ServiceMonitor and PodMonitor custom resources. More specifically, it
synchronizes the configuration of the Prometheus server based on the spec of
the Prometheus CR and ensures that metrics from all targets referred to by
existing ServiceMonitors and PodMonitors are collected.
The frontend of the Rok Monitoring Stack is based on Grafana, an observability and analytics platform that allows you to query, visualize, alert on and understand collected metrics. It is data-driven, can connect to multiple backends and provides a huge variety of dashboards to explore your data.
Note
Both Prometheus and Grafana provide a graphical user interface to query Prometheus’s time series database and visualize collected metrics. For more details on accessing these UIs on EKF see the Rok Monitoring Stack UIs user guide.
See also
The Rok Monitoring Stack also supports but does not currently deploy the following components:
| Alert Manager | A system that handles alerts sent by client applications, such as the Prometheus server, and takes care of deduplicating, grouping, and routing them to the correct receiver integrations. |
| Prometheus Adapter | A component that exposes custom, application-specific metrics via the Kubernetes Custom Metrics API, so that the HPA controller or some other entity can use them. |
Note
By default, RMS does not set up Prometheus Alert Manager and Prometheus Adapter instances. These components are optional and their configuration depends on the characteristics and needs of each installation.
Monitoring Targets
If you have already deployed Arrikto EKF, then you have also deployed the Rok Monitoring Stack with all its components. In this section we describe how we configure Rok Prometheus to monitor:
Note
The Rok Monitoring Stack creates RBAC resources that grant Prometheus
sufficient permissions to perform get, list, and watch
operations on Pods, Services, and Endpoints in the namespace
where Rok is deployed.
Physical Nodes
To monitor the physical nodes (or cloud VMs) that host Kubernetes and, in turn, applications running on it, we need a way to gather and export critical system metrics in order to expose the overall state regarding CPU usage, memory consumption, disk I/O, network traffic, and other resources. The standard way to achieve this in a Prometheus-based monitoring stack is to run a Node Exporter instance on each node which, in turn, runs a set of collectors for both hardware and OS metrics exposed by the kernel.
The Rok Monitoring Stack deploys Node Exporter as a DaemonSet to retrieve
system metrics from all nodes.
To configure Prometheus to periodically collect metrics from the Node Exporter,
the Rok Monitoring Stack creates a ServiceMonitor custom resource that
selects the Node Exporter Service (node-exporter.monitoring) and looks
like:

| 1 | apiVersion: monitoring.coreos.com/v1 | |
| 2 | kind: ServiceMonitor | |
| 3 | metadata: | |
| 4-24 | ||
| 4 | labels: | |
| 5 | app.kubernetes.io/name: node-exporter | |
| 6 | app.kubernetes.io/version: v1.0.1 | |
| 7 | name: node-exporter | |
| 8 | namespace: monitoring | |
| 9 | spec: | |
| 10 | endpoints: | |
| 11 | - bearerTokenFile: /var/run/secrets/kubernetes.io/serviceaccount/token | |
| 12 | interval: 15s | |
| 13 | port: https | |
| 14 | relabelings: | |
| 15 | - action: replace | |
| 16 | regex: (.*) | |
| 17 | replacement: $1 | |
| 18 | sourceLabels: | |
| 19 | - __meta_kubernetes_pod_node_name | |
| 20 | targetLabel: instance | |
| 21 | scheme: https | |
| 22 | tlsConfig: | |
| 23 | insecureSkipVerify: true | |
| 24 | jobLabel: app.kubernetes.io/name | |
| 25 | selector: | |
| 26 | matchLabels: | |
| 27 | app.kubernetes.io/name: node-exporter |
Kubernetes
To monitor Kubernetes we need a way to gather and export metrics from core
Kubernetes components, such as the Kubernetes API Server, Kubelet, the
Kubernetes Scheduler, the Kubernetes Controller Manager, CoreDNS, etc. These
components already collect and expose metrics in the Prometheus data format via
Kubernetes Services.
Note
cAdvisor is an open-source agent that is integrated into the kubelet binary that monitors resource usage and analyzes the performance of containers. It collects statistics about the CPU, memory, file, and network usage for all containers running on a given node (it does not operate at the pod level).
In addition, we need to gather and export metrics from Kubernetes API
resources, such as StatefulSets, DaemonSets,
PersistentVolumeClaims, etc. The standard way to achieve this in a
Prometheus-based monitoring stack is to deploy Kube State Metrics in the Kubernetes cluster
to be monitored. Kube State Metrics focuses on generating completely new
metrics based on the state of Kubernetes API objects. It holds an entire
snapshot of Kubernetes state in memory and continuously generates new metrics
based on it.
Warning
In managed cloud environments, such as EKS, GKE and AKS, metrics from Kubernetes components that are exclusively running on the master node (such as the scheduler and the controller manager) might not be available by default.
To configure Prometheus to periodically collect metrics from Kubernetes, the
Rok Monitoring Stack creates multiple ServiceMonitor custom resources that
select individual Kubernetes Services:
| 1 | apiVersion: monitoring.coreos.com/v1 | |
| 2 | kind: ServiceMonitor | |
| 3 | metadata: | |
| 4-28 | ||
| 4 | labels: | |
| 5 | app.kubernetes.io/name: kube-state-metrics | |
| 6 | app.kubernetes.io/version: 1.9.7 | |
| 7 | name: kube-state-metrics | |
| 8 | namespace: monitoring | |
| 9 | spec: | |
| 10 | endpoints: | |
| 11 | - bearerTokenFile: /var/run/secrets/kubernetes.io/serviceaccount/token | |
| 12 | honorLabels: true | |
| 13 | interval: 30s | |
| 14 | port: https-main | |
| 15 | relabelings: | |
| 16 | - action: labeldrop | |
| 17 | regex: (pod|service|endpoint|namespace) | |
| 18 | scheme: https | |
| 19 | scrapeTimeout: 30s | |
| 20 | tlsConfig: | |
| 21 | insecureSkipVerify: true | |
| 22 | - bearerTokenFile: /var/run/secrets/kubernetes.io/serviceaccount/token | |
| 23 | interval: 30s | |
| 24 | port: https-self | |
| 25 | scheme: https | |
| 26 | tlsConfig: | |
| 27 | insecureSkipVerify: true | |
| 28 | jobLabel: app.kubernetes.io/name | |
| 29 | selector: | |
| 30 | matchLabels: | |
| 31 | app.kubernetes.io/name: kube-state-metrics |
| 1 | apiVersion: monitoring.coreos.com/v1 | |
| 2 | kind: ServiceMonitor | |
| 3 | metadata: | |
| 4-93 | ||
| 4 | labels: | |
| 5 | k8s-app: kubelet | |
| 6 | name: kubelet | |
| 7 | namespace: monitoring | |
| 8 | spec: | |
| 9 | endpoints: | |
| 10 | - bearerTokenFile: /var/run/secrets/kubernetes.io/serviceaccount/token | |
| 11 | honorLabels: true | |
| 12 | interval: 30s | |
| 13 | metricRelabelings: | |
| 14 | - action: drop | |
| 15 | regex: kubelet_(pod_worker_latency_microseconds|pod_start_latency_microseconds|cgroup_manager_latency_microseconds|pod_worker_start_latency_microseconds|pleg_relist_latency_microseconds|pleg_relist_interval_microseconds|runtime_operations|runtime_operations_latency_microseconds|runtime_operations_errors|eviction_stats_age_microseconds|device_plugin_registration_count|device_plugin_alloc_latency_microseconds|network_plugin_operations_latency_microseconds) | |
| 16 | sourceLabels: | |
| 17 | - __name__ | |
| 18 | - action: drop | |
| 19 | regex: scheduler_(e2e_scheduling_latency_microseconds|scheduling_algorithm_predicate_evaluation|scheduling_algorithm_priority_evaluation|scheduling_algorithm_preemption_evaluation|scheduling_algorithm_latency_microseconds|binding_latency_microseconds|scheduling_latency_seconds) | |
| 20 | sourceLabels: | |
| 21 | - __name__ | |
| 22 | - action: drop | |
| 23 | regex: apiserver_(request_count|request_latencies|request_latencies_summary|dropped_requests|storage_data_key_generation_latencies_microseconds|storage_transformation_failures_total|storage_transformation_latencies_microseconds|proxy_tunnel_sync_latency_secs) | |
| 24 | sourceLabels: | |
| 25 | - __name__ | |
| 26 | - action: drop | |
| 27 | regex: kubelet_docker_(operations|operations_latency_microseconds|operations_errors|operations_timeout) | |
| 28 | sourceLabels: | |
| 29 | - __name__ | |
| 30 | - action: drop | |
| 31 | regex: reflector_(items_per_list|items_per_watch|list_duration_seconds|lists_total|short_watches_total|watch_duration_seconds|watches_total) | |
| 32 | sourceLabels: | |
| 33 | - __name__ | |
| 34 | - action: drop | |
| 35 | regex: etcd_(helper_cache_hit_count|helper_cache_miss_count|helper_cache_entry_count|request_cache_get_latencies_summary|request_cache_add_latencies_summary|request_latencies_summary) | |
| 36 | sourceLabels: | |
| 37 | - __name__ | |
| 38 | - action: drop | |
| 39 | regex: transformation_(transformation_latencies_microseconds|failures_total) | |
| 40 | sourceLabels: | |
| 41 | - __name__ | |
| 42 | - action: drop | |
| 43 | regex: (admission_quota_controller_adds|crd_autoregistration_controller_work_duration|APIServiceOpenAPIAggregationControllerQueue1_adds|AvailableConditionController_retries|crd_openapi_controller_unfinished_work_seconds|APIServiceRegistrationController_retries|admission_quota_controller_longest_running_processor_microseconds|crdEstablishing_longest_running_processor_microseconds|crdEstablishing_unfinished_work_seconds|crd_openapi_controller_adds|crd_autoregistration_controller_retries|crd_finalizer_queue_latency|AvailableConditionController_work_duration|non_structural_schema_condition_controller_depth|crd_autoregistration_controller_unfinished_work_seconds|AvailableConditionController_adds|DiscoveryController_longest_running_processor_microseconds|autoregister_queue_latency|crd_autoregistration_controller_adds|non_structural_schema_condition_controller_work_duration|APIServiceRegistrationController_adds|crd_finalizer_work_duration|crd_naming_condition_controller_unfinished_work_seconds|crd_openapi_controller_longest_running_processor_microseconds|DiscoveryController_adds|crd_autoregistration_controller_longest_running_processor_microseconds|autoregister_unfinished_work_seconds|crd_naming_condition_controller_queue_latency|crd_naming_condition_controller_retries|non_structural_schema_condition_controller_queue_latency|crd_naming_condition_controller_depth|AvailableConditionController_longest_running_processor_microseconds|crdEstablishing_depth|crd_finalizer_longest_running_processor_microseconds|crd_naming_condition_controller_adds|APIServiceOpenAPIAggregationControllerQueue1_longest_running_processor_microseconds|DiscoveryController_queue_latency|DiscoveryController_unfinished_work_seconds|crd_openapi_controller_depth|APIServiceOpenAPIAggregationControllerQueue1_queue_latency|APIServiceOpenAPIAggregationControllerQueue1_unfinished_work_seconds|DiscoveryController_work_duration|autoregister_adds|crd_autoregistration_controller_queue_latency|crd_finalizer_retries|AvailableConditionController_unfinished_work_seconds|autoregister_longest_running_processor_microseconds|non_structural_schema_condition_controller_unfinished_work_seconds|APIServiceOpenAPIAggregationControllerQueue1_depth|AvailableConditionController_depth|DiscoveryController_retries|admission_quota_controller_depth|crdEstablishing_adds|APIServiceOpenAPIAggregationControllerQueue1_retries|crdEstablishing_queue_latency|non_structural_schema_condition_controller_longest_running_processor_microseconds|autoregister_work_duration|crd_openapi_controller_retries|APIServiceRegistrationController_work_duration|crdEstablishing_work_duration|crd_finalizer_adds|crd_finalizer_depth|crd_openapi_controller_queue_latency|APIServiceOpenAPIAggregationControllerQueue1_work_duration|APIServiceRegistrationController_queue_latency|crd_autoregistration_controller_depth|AvailableConditionController_queue_latency|admission_quota_controller_queue_latency|crd_naming_condition_controller_work_duration|crd_openapi_controller_work_duration|DiscoveryController_depth|crd_naming_condition_controller_longest_running_processor_microseconds|APIServiceRegistrationController_depth|APIServiceRegistrationController_longest_running_processor_microseconds|crd_finalizer_unfinished_work_seconds|crdEstablishing_retries|admission_quota_controller_unfinished_work_seconds|non_structural_schema_condition_controller_adds|APIServiceRegistrationController_unfinished_work_seconds|admission_quota_controller_work_duration|autoregister_depth|autoregister_retries|kubeproxy_sync_proxy_rules_latency_microseconds|rest_client_request_latency_seconds|non_structural_schema_condition_controller_retries) | |
| 44 | sourceLabels: | |
| 45 | - __name__ | |
| 46 | port: https-metrics | |
| 47 | relabelings: | |
| 48 | - sourceLabels: | |
| 49 | - __metrics_path__ | |
| 50 | targetLabel: metrics_path | |
| 51 | scheme: https | |
| 52 | tlsConfig: | |
| 53 | insecureSkipVerify: true | |
| 54 | - bearerTokenFile: /var/run/secrets/kubernetes.io/serviceaccount/token | |
| 55 | honorLabels: true | |
| 56 | honorTimestamps: false | |
| 57 | interval: 30s | |
| 58 | metricRelabelings: | |
| 59 | - action: drop | |
| 60 | regex: container_(network_tcp_usage_total|network_udp_usage_total|tasks_state|cpu_load_average_10s) | |
| 61 | sourceLabels: | |
| 62 | - __name__ | |
| 63 | - action: drop | |
| 64 | regex: (container_fs_.*|container_spec_.*|container_blkio_device_usage_total|container_file_descriptors|container_sockets|container_threads_max|container_threads|container_start_time_seconds|container_last_seen);; | |
| 65 | sourceLabels: | |
| 66 | - __name__ | |
| 67 | - pod | |
| 68 | - namespace | |
| 69 | path: /metrics/cadvisor | |
| 70 | port: https-metrics | |
| 71 | relabelings: | |
| 72 | - sourceLabels: | |
| 73 | - __metrics_path__ | |
| 74 | targetLabel: metrics_path | |
| 75 | scheme: https | |
| 76 | tlsConfig: | |
| 77 | insecureSkipVerify: true | |
| 78 | - bearerTokenFile: /var/run/secrets/kubernetes.io/serviceaccount/token | |
| 79 | honorLabels: true | |
| 80 | interval: 30s | |
| 81 | path: /metrics/probes | |
| 82 | port: https-metrics | |
| 83 | relabelings: | |
| 84 | - sourceLabels: | |
| 85 | - __metrics_path__ | |
| 86 | targetLabel: metrics_path | |
| 87 | scheme: https | |
| 88 | tlsConfig: | |
| 89 | insecureSkipVerify: true | |
| 90 | jobLabel: k8s-app | |
| 91 | namespaceSelector: | |
| 92 | matchNames: | |
| 93 | - kube-system | |
| 94 | selector: | |
| 95 | matchLabels: | |
| 96 | k8s-app: kubelet |
| 1 | apiVersion: monitoring.coreos.com/v1 | |
| 2 | kind: ServiceMonitor | |
| 3 | metadata: | |
| 4-71 | ||
| 4 | labels: | |
| 5 | k8s-app: apiserver | |
| 6 | name: kube-apiserver | |
| 7 | namespace: monitoring | |
| 8 | spec: | |
| 9 | endpoints: | |
| 10 | - bearerTokenFile: /var/run/secrets/kubernetes.io/serviceaccount/token | |
| 11 | interval: 30s | |
| 12 | metricRelabelings: | |
| 13 | - action: drop | |
| 14 | regex: kubelet_(pod_worker_latency_microseconds|pod_start_latency_microseconds|cgroup_manager_latency_microseconds|pod_worker_start_latency_microseconds|pleg_relist_latency_microseconds|pleg_relist_interval_microseconds|runtime_operations|runtime_operations_latency_microseconds|runtime_operations_errors|eviction_stats_age_microseconds|device_plugin_registration_count|device_plugin_alloc_latency_microseconds|network_plugin_operations_latency_microseconds) | |
| 15 | sourceLabels: | |
| 16 | - __name__ | |
| 17 | - action: drop | |
| 18 | regex: scheduler_(e2e_scheduling_latency_microseconds|scheduling_algorithm_predicate_evaluation|scheduling_algorithm_priority_evaluation|scheduling_algorithm_preemption_evaluation|scheduling_algorithm_latency_microseconds|binding_latency_microseconds|scheduling_latency_seconds) | |
| 19 | sourceLabels: | |
| 20 | - __name__ | |
| 21 | - action: drop | |
| 22 | regex: apiserver_(request_count|request_latencies|request_latencies_summary|dropped_requests|storage_data_key_generation_latencies_microseconds|storage_transformation_failures_total|storage_transformation_latencies_microseconds|proxy_tunnel_sync_latency_secs) | |
| 23 | sourceLabels: | |
| 24 | - __name__ | |
| 25 | - action: drop | |
| 26 | regex: kubelet_docker_(operations|operations_latency_microseconds|operations_errors|operations_timeout) | |
| 27 | sourceLabels: | |
| 28 | - __name__ | |
| 29 | - action: drop | |
| 30 | regex: reflector_(items_per_list|items_per_watch|list_duration_seconds|lists_total|short_watches_total|watch_duration_seconds|watches_total) | |
| 31 | sourceLabels: | |
| 32 | - __name__ | |
| 33 | - action: drop | |
| 34 | regex: etcd_(helper_cache_hit_count|helper_cache_miss_count|helper_cache_entry_count|request_cache_get_latencies_summary|request_cache_add_latencies_summary|request_latencies_summary) | |
| 35 | sourceLabels: | |
| 36 | - __name__ | |
| 37 | - action: drop | |
| 38 | regex: transformation_(transformation_latencies_microseconds|failures_total) | |
| 39 | sourceLabels: | |
| 40 | - __name__ | |
| 41 | - action: drop | |
| 42 | regex: (admission_quota_controller_adds|crd_autoregistration_controller_work_duration|APIServiceOpenAPIAggregationControllerQueue1_adds|AvailableConditionController_retries|crd_openapi_controller_unfinished_work_seconds|APIServiceRegistrationController_retries|admission_quota_controller_longest_running_processor_microseconds|crdEstablishing_longest_running_processor_microseconds|crdEstablishing_unfinished_work_seconds|crd_openapi_controller_adds|crd_autoregistration_controller_retries|crd_finalizer_queue_latency|AvailableConditionController_work_duration|non_structural_schema_condition_controller_depth|crd_autoregistration_controller_unfinished_work_seconds|AvailableConditionController_adds|DiscoveryController_longest_running_processor_microseconds|autoregister_queue_latency|crd_autoregistration_controller_adds|non_structural_schema_condition_controller_work_duration|APIServiceRegistrationController_adds|crd_finalizer_work_duration|crd_naming_condition_controller_unfinished_work_seconds|crd_openapi_controller_longest_running_processor_microseconds|DiscoveryController_adds|crd_autoregistration_controller_longest_running_processor_microseconds|autoregister_unfinished_work_seconds|crd_naming_condition_controller_queue_latency|crd_naming_condition_controller_retries|non_structural_schema_condition_controller_queue_latency|crd_naming_condition_controller_depth|AvailableConditionController_longest_running_processor_microseconds|crdEstablishing_depth|crd_finalizer_longest_running_processor_microseconds|crd_naming_condition_controller_adds|APIServiceOpenAPIAggregationControllerQueue1_longest_running_processor_microseconds|DiscoveryController_queue_latency|DiscoveryController_unfinished_work_seconds|crd_openapi_controller_depth|APIServiceOpenAPIAggregationControllerQueue1_queue_latency|APIServiceOpenAPIAggregationControllerQueue1_unfinished_work_seconds|DiscoveryController_work_duration|autoregister_adds|crd_autoregistration_controller_queue_latency|crd_finalizer_retries|AvailableConditionController_unfinished_work_seconds|autoregister_longest_running_processor_microseconds|non_structural_schema_condition_controller_unfinished_work_seconds|APIServiceOpenAPIAggregationControllerQueue1_depth|AvailableConditionController_depth|DiscoveryController_retries|admission_quota_controller_depth|crdEstablishing_adds|APIServiceOpenAPIAggregationControllerQueue1_retries|crdEstablishing_queue_latency|non_structural_schema_condition_controller_longest_running_processor_microseconds|autoregister_work_duration|crd_openapi_controller_retries|APIServiceRegistrationController_work_duration|crdEstablishing_work_duration|crd_finalizer_adds|crd_finalizer_depth|crd_openapi_controller_queue_latency|APIServiceOpenAPIAggregationControllerQueue1_work_duration|APIServiceRegistrationController_queue_latency|crd_autoregistration_controller_depth|AvailableConditionController_queue_latency|admission_quota_controller_queue_latency|crd_naming_condition_controller_work_duration|crd_openapi_controller_work_duration|DiscoveryController_depth|crd_naming_condition_controller_longest_running_processor_microseconds|APIServiceRegistrationController_depth|APIServiceRegistrationController_longest_running_processor_microseconds|crd_finalizer_unfinished_work_seconds|crdEstablishing_retries|admission_quota_controller_unfinished_work_seconds|non_structural_schema_condition_controller_adds|APIServiceRegistrationController_unfinished_work_seconds|admission_quota_controller_work_duration|autoregister_depth|autoregister_retries|kubeproxy_sync_proxy_rules_latency_microseconds|rest_client_request_latency_seconds|non_structural_schema_condition_controller_retries) | |
| 43 | sourceLabels: | |
| 44 | - __name__ | |
| 45 | - action: drop | |
| 46 | regex: etcd_(debugging|disk|server).* | |
| 47 | sourceLabels: | |
| 48 | - __name__ | |
| 49 | - action: drop | |
| 50 | regex: apiserver_admission_controller_admission_latencies_seconds_.* | |
| 51 | sourceLabels: | |
| 52 | - __name__ | |
| 53 | - action: drop | |
| 54 | regex: apiserver_admission_step_admission_latencies_seconds_.* | |
| 55 | sourceLabels: | |
| 56 | - __name__ | |
| 57 | - action: drop | |
| 58 | regex: apiserver_request_duration_seconds_bucket;(0.15|0.25|0.3|0.35|0.4|0.45|0.6|0.7|0.8|0.9|1.25|1.5|1.75|2.5|3|3.5|4.5|6|7|8|9|15|25|30|50) | |
| 59 | sourceLabels: | |
| 60 | - __name__ | |
| 61 | - le | |
| 62 | port: https | |
| 63 | scheme: https | |
| 64 | tlsConfig: | |
| 65 | caFile: /var/run/secrets/kubernetes.io/serviceaccount/ca.crt | |
| 66 | serverName: kubernetes | |
| 67 | jobLabel: component | |
| 68 | namespaceSelector: | |
| 69 | matchNames: | |
| 70 | - default | |
| 71 | selector: | |
| 72 | matchLabels: | |
| 73 | component: apiserver | |
| 74 | provider: kubernetes |
| 1 | apiVersion: monitoring.coreos.com/v1 | |
| 2 | kind: ServiceMonitor | |
| 3 | metadata: | |
| 4-56 | ||
| 4 | labels: | |
| 5 | k8s-app: kube-controller-manager | |
| 6 | name: kube-controller-manager | |
| 7 | namespace: monitoring | |
| 8 | spec: | |
| 9 | endpoints: | |
| 10 | - bearerTokenFile: /var/run/secrets/kubernetes.io/serviceaccount/token | |
| 11 | interval: 30s | |
| 12 | metricRelabelings: | |
| 13 | - action: drop | |
| 14 | regex: kubelet_(pod_worker_latency_microseconds|pod_start_latency_microseconds|cgroup_manager_latency_microseconds|pod_worker_start_latency_microseconds|pleg_relist_latency_microseconds|pleg_relist_interval_microseconds|runtime_operations|runtime_operations_latency_microseconds|runtime_operations_errors|eviction_stats_age_microseconds|device_plugin_registration_count|device_plugin_alloc_latency_microseconds|network_plugin_operations_latency_microseconds) | |
| 15 | sourceLabels: | |
| 16 | - __name__ | |
| 17 | - action: drop | |
| 18 | regex: scheduler_(e2e_scheduling_latency_microseconds|scheduling_algorithm_predicate_evaluation|scheduling_algorithm_priority_evaluation|scheduling_algorithm_preemption_evaluation|scheduling_algorithm_latency_microseconds|binding_latency_microseconds|scheduling_latency_seconds) | |
| 19 | sourceLabels: | |
| 20 | - __name__ | |
| 21 | - action: drop | |
| 22 | regex: apiserver_(request_count|request_latencies|request_latencies_summary|dropped_requests|storage_data_key_generation_latencies_microseconds|storage_transformation_failures_total|storage_transformation_latencies_microseconds|proxy_tunnel_sync_latency_secs) | |
| 23 | sourceLabels: | |
| 24 | - __name__ | |
| 25 | - action: drop | |
| 26 | regex: kubelet_docker_(operations|operations_latency_microseconds|operations_errors|operations_timeout) | |
| 27 | sourceLabels: | |
| 28 | - __name__ | |
| 29 | - action: drop | |
| 30 | regex: reflector_(items_per_list|items_per_watch|list_duration_seconds|lists_total|short_watches_total|watch_duration_seconds|watches_total) | |
| 31 | sourceLabels: | |
| 32 | - __name__ | |
| 33 | - action: drop | |
| 34 | regex: etcd_(helper_cache_hit_count|helper_cache_miss_count|helper_cache_entry_count|request_cache_get_latencies_summary|request_cache_add_latencies_summary|request_latencies_summary) | |
| 35 | sourceLabels: | |
| 36 | - __name__ | |
| 37 | - action: drop | |
| 38 | regex: transformation_(transformation_latencies_microseconds|failures_total) | |
| 39 | sourceLabels: | |
| 40 | - __name__ | |
| 41 | - action: drop | |
| 42 | regex: (admission_quota_controller_adds|crd_autoregistration_controller_work_duration|APIServiceOpenAPIAggregationControllerQueue1_adds|AvailableConditionController_retries|crd_openapi_controller_unfinished_work_seconds|APIServiceRegistrationController_retries|admission_quota_controller_longest_running_processor_microseconds|crdEstablishing_longest_running_processor_microseconds|crdEstablishing_unfinished_work_seconds|crd_openapi_controller_adds|crd_autoregistration_controller_retries|crd_finalizer_queue_latency|AvailableConditionController_work_duration|non_structural_schema_condition_controller_depth|crd_autoregistration_controller_unfinished_work_seconds|AvailableConditionController_adds|DiscoveryController_longest_running_processor_microseconds|autoregister_queue_latency|crd_autoregistration_controller_adds|non_structural_schema_condition_controller_work_duration|APIServiceRegistrationController_adds|crd_finalizer_work_duration|crd_naming_condition_controller_unfinished_work_seconds|crd_openapi_controller_longest_running_processor_microseconds|DiscoveryController_adds|crd_autoregistration_controller_longest_running_processor_microseconds|autoregister_unfinished_work_seconds|crd_naming_condition_controller_queue_latency|crd_naming_condition_controller_retries|non_structural_schema_condition_controller_queue_latency|crd_naming_condition_controller_depth|AvailableConditionController_longest_running_processor_microseconds|crdEstablishing_depth|crd_finalizer_longest_running_processor_microseconds|crd_naming_condition_controller_adds|APIServiceOpenAPIAggregationControllerQueue1_longest_running_processor_microseconds|DiscoveryController_queue_latency|DiscoveryController_unfinished_work_seconds|crd_openapi_controller_depth|APIServiceOpenAPIAggregationControllerQueue1_queue_latency|APIServiceOpenAPIAggregationControllerQueue1_unfinished_work_seconds|DiscoveryController_work_duration|autoregister_adds|crd_autoregistration_controller_queue_latency|crd_finalizer_retries|AvailableConditionController_unfinished_work_seconds|autoregister_longest_running_processor_microseconds|non_structural_schema_condition_controller_unfinished_work_seconds|APIServiceOpenAPIAggregationControllerQueue1_depth|AvailableConditionController_depth|DiscoveryController_retries|admission_quota_controller_depth|crdEstablishing_adds|APIServiceOpenAPIAggregationControllerQueue1_retries|crdEstablishing_queue_latency|non_structural_schema_condition_controller_longest_running_processor_microseconds|autoregister_work_duration|crd_openapi_controller_retries|APIServiceRegistrationController_work_duration|crdEstablishing_work_duration|crd_finalizer_adds|crd_finalizer_depth|crd_openapi_controller_queue_latency|APIServiceOpenAPIAggregationControllerQueue1_work_duration|APIServiceRegistrationController_queue_latency|crd_autoregistration_controller_depth|AvailableConditionController_queue_latency|admission_quota_controller_queue_latency|crd_naming_condition_controller_work_duration|crd_openapi_controller_work_duration|DiscoveryController_depth|crd_naming_condition_controller_longest_running_processor_microseconds|APIServiceRegistrationController_depth|APIServiceRegistrationController_longest_running_processor_microseconds|crd_finalizer_unfinished_work_seconds|crdEstablishing_retries|admission_quota_controller_unfinished_work_seconds|non_structural_schema_condition_controller_adds|APIServiceRegistrationController_unfinished_work_seconds|admission_quota_controller_work_duration|autoregister_depth|autoregister_retries|kubeproxy_sync_proxy_rules_latency_microseconds|rest_client_request_latency_seconds|non_structural_schema_condition_controller_retries) | |
| 43 | sourceLabels: | |
| 44 | - __name__ | |
| 45 | - action: drop | |
| 46 | regex: etcd_(debugging|disk|request|server).* | |
| 47 | sourceLabels: | |
| 48 | - __name__ | |
| 49 | port: https-metrics | |
| 50 | scheme: https | |
| 51 | tlsConfig: | |
| 52 | insecureSkipVerify: true | |
| 53 | jobLabel: k8s-app | |
| 54 | namespaceSelector: | |
| 55 | matchNames: | |
| 56 | - kube-system | |
| 57 | selector: | |
| 58 | matchLabels: | |
| 59 | k8s-app: kube-controller-manager |
| 1 | apiVersion: monitoring.coreos.com/v1 | |
| 2 | kind: ServiceMonitor | |
| 3 | metadata: | |
| 4-19 | ||
| 4 | labels: | |
| 5 | k8s-app: kube-scheduler | |
| 6 | name: kube-scheduler | |
| 7 | namespace: monitoring | |
| 8 | spec: | |
| 9 | endpoints: | |
| 10 | - bearerTokenFile: /var/run/secrets/kubernetes.io/serviceaccount/token | |
| 11 | interval: 30s | |
| 12 | port: https-metrics | |
| 13 | scheme: https | |
| 14 | tlsConfig: | |
| 15 | insecureSkipVerify: true | |
| 16 | jobLabel: k8s-app | |
| 17 | namespaceSelector: | |
| 18 | matchNames: | |
| 19 | - kube-system | |
| 20 | selector: | |
| 21 | matchLabels: | |
| 22 | k8s-app: kube-scheduler |
EKF Istio
Arrikto EKF uses Istio as the service mesh for microservices. Monitoring Istio with the Rok Monitoring Stack is a work in progress.
Rok Etcd
Rok uses etcd as a key-value store to save Rok data and metadata. To make
Prometheus aware of Rok etcd and configure it to periodically scrape metrics
from it, the Rok Monitoring Stack creates a ServiceMonitor custom resource
that selects the Rok etcd Service (rok-etcd.rok):
| 1 | # This file is part of Rok. | |
| 2 | # | |
| 3 | # Copyright © 2020, 2022 Arrikto Inc. All Rights Reserved. | |
| 4-17 | ||
| 4 | ||
| 5 | apiVersion: monitoring.coreos.com/v1 | |
| 6 | kind: ServiceMonitor | |
| 7 | metadata: | |
| 8 | name: rok-etcd-metrics | |
| 9 | namespace: rok | |
| 10 | spec: | |
| 11 | endpoints: | |
| 12 | - interval: 15s | |
| 13 | port: tcp-client | |
| 14 | namespaceSelector: | |
| 15 | matchNames: | |
| 16 | - rok | |
| 17 | selector: | |
| 18 | matchLabels: | |
| 19 | app: etcd | |
| 20 | app.kubernetes.io/part-of: rok |
See also
For detailed information on how to monitor Rok etcd, see the Etcd Monitoring user guide.
Rok Redis
Rok uses Redis as an in-memory data structure store to cache metadata. To make
Prometheus aware of Rok Redis and configure it to periodically scrape metrics
from it, the Rok Monitoring Stack creates a ServiceMonitor custom resource
that selects the Rok Redis metrics Service (rok-redis-metrics.rok):
| 1 | # This file is part of Rok. | |
| 2 | # | |
| 3 | # Copyright © 2020 Arrikto Inc. All Rights Reserved. | |
| 4-17 | ||
| 4 | ||
| 5 | apiVersion: monitoring.coreos.com/v1 | |
| 6 | kind: ServiceMonitor | |
| 7 | metadata: | |
| 8 | name: rok-redis-metrics | |
| 9 | namespace: rok | |
| 10 | spec: | |
| 11 | endpoints: | |
| 12 | - interval: 15s | |
| 13 | port: http-metrics | |
| 14 | namespaceSelector: | |
| 15 | matchNames: | |
| 16 | - rok | |
| 17 | selector: | |
| 18 | matchLabels: | |
| 19 | app: redis | |
| 20 | app.kubernetes.io/part-of: rok |
Rok
Rok is natively integrated with Prometheus, as it serves the /metrics HTTP
endpoint and exposes metrics to the outer world using Prometheus’s data model
and text-based format.
To make Prometheus aware of Rok and configure it to periodically scrape metrics
from it, the Rok Monitoring Stack creates a ServiceMonitor custom resource
that selects the Rok Service (rok.rok):
| 1 | # This file is part of Rok. | |
| 2 | # | |
| 3 | # Copyright © 2020 Arrikto Inc. All Rights Reserved. | |
| 4-17 | ||
| 4 | ||
| 5 | apiVersion: monitoring.coreos.com/v1 | |
| 6 | kind: ServiceMonitor | |
| 7 | metadata: | |
| 8 | name: rok-metrics | |
| 9 | namespace: rok | |
| 10 | spec: | |
| 11 | endpoints: | |
| 12 | - interval: 15s | |
| 13 | port: http-rok | |
| 14 | namespaceSelector: | |
| 15 | matchNames: | |
| 16 | - rok | |
| 17 | selector: | |
| 18 | matchLabels: | |
| 19 | rok-cluster: rok | |
| 20 | app.kubernetes.io/part-of: rok |
See also
For detailed information on how to monitor Rok, see the Rok Monitoring user guide.
Summary
In this guide you gained insight on the architecture, components and default configuration of the Rok Monitoring Stack.
What’s Next
The next step is to learn how to access the UIs of the Rok Monitoring Stack.