
Free Node Space Monitoring
One of the most important areas to monitor in your EKF cluster is the availability of free space per node. This is essential to prevent hosts from running out of space, e.g., when workloads aggressively consume storage or fail to garbage collect old artifacts.
What You’ll Need
- An existing Kubernetes cluster.
- An existing Rok deployment.
- Access to the Rok Monitoring Stack UI.
Important
Before proceeding, ensure that you have been granted proper rights to access the Rok Monitoring Stack UI. Currently, access to the Rok Monitoring Stack is allowed only to admin users.
Metrics
The Prometheus Node Exporter exposes metrics related to the available
filesystem space per node under the node_filesystem_ prefix.
The table below lists the Prometheus Node Exporter metrics that help you monitor the free space per physical node:
| Name | Description | Type |
|---|---|---|
| node_filesystem_avail_bytes | Filesystem space available to non-root users in bytes | Gauge |
| node_filesystem_size_bytes | Filesystem size in bytes | Gauge |
| node_filesystem_free_bytes | Filesystem free space in bytes | Gauge |
| node_filesystem_files | Filesystem total file nodes | Gauge |
| node_filesystem_files_free | Filesystem total free file nodes | Gauge |
View Grafana Dashboards
The Rok Monitoring Stack provides the following dashboards to visualize free space per node:
- Node Exporter: a full-fledged dashboard that queries and visualizes the majority of the metrics that the Prometheus Node Exporter collects.
- Nodes: a stripped-down version of the Node Exporter dashboard that queries and visualizes a subset with some of the most important metrics that the Prometheus Node Exporter collects.
- USE Method / Node: a concise dashboard targeted on node utilization, saturation, and errors.
- USE Method / Cluster: a concise dashboard targeted on cluster utilization, saturation, and errors.
Note
USE Method stands for Utilization Saturation and Errors Method. The USE Method is a methodology for analyzing the performance of a system.
Note
The Rok Monitoring Stack places Grafana dashboards for individual EKF
components under the EKF folder.
See also
Visit the Kubeflow central dashboard with your browser at
https://<FQDN>Replace
<FQDN>with your the value of your domain. For example:https://arrikto-cluster.apps.example.comIf prompted, log in using your credentials:
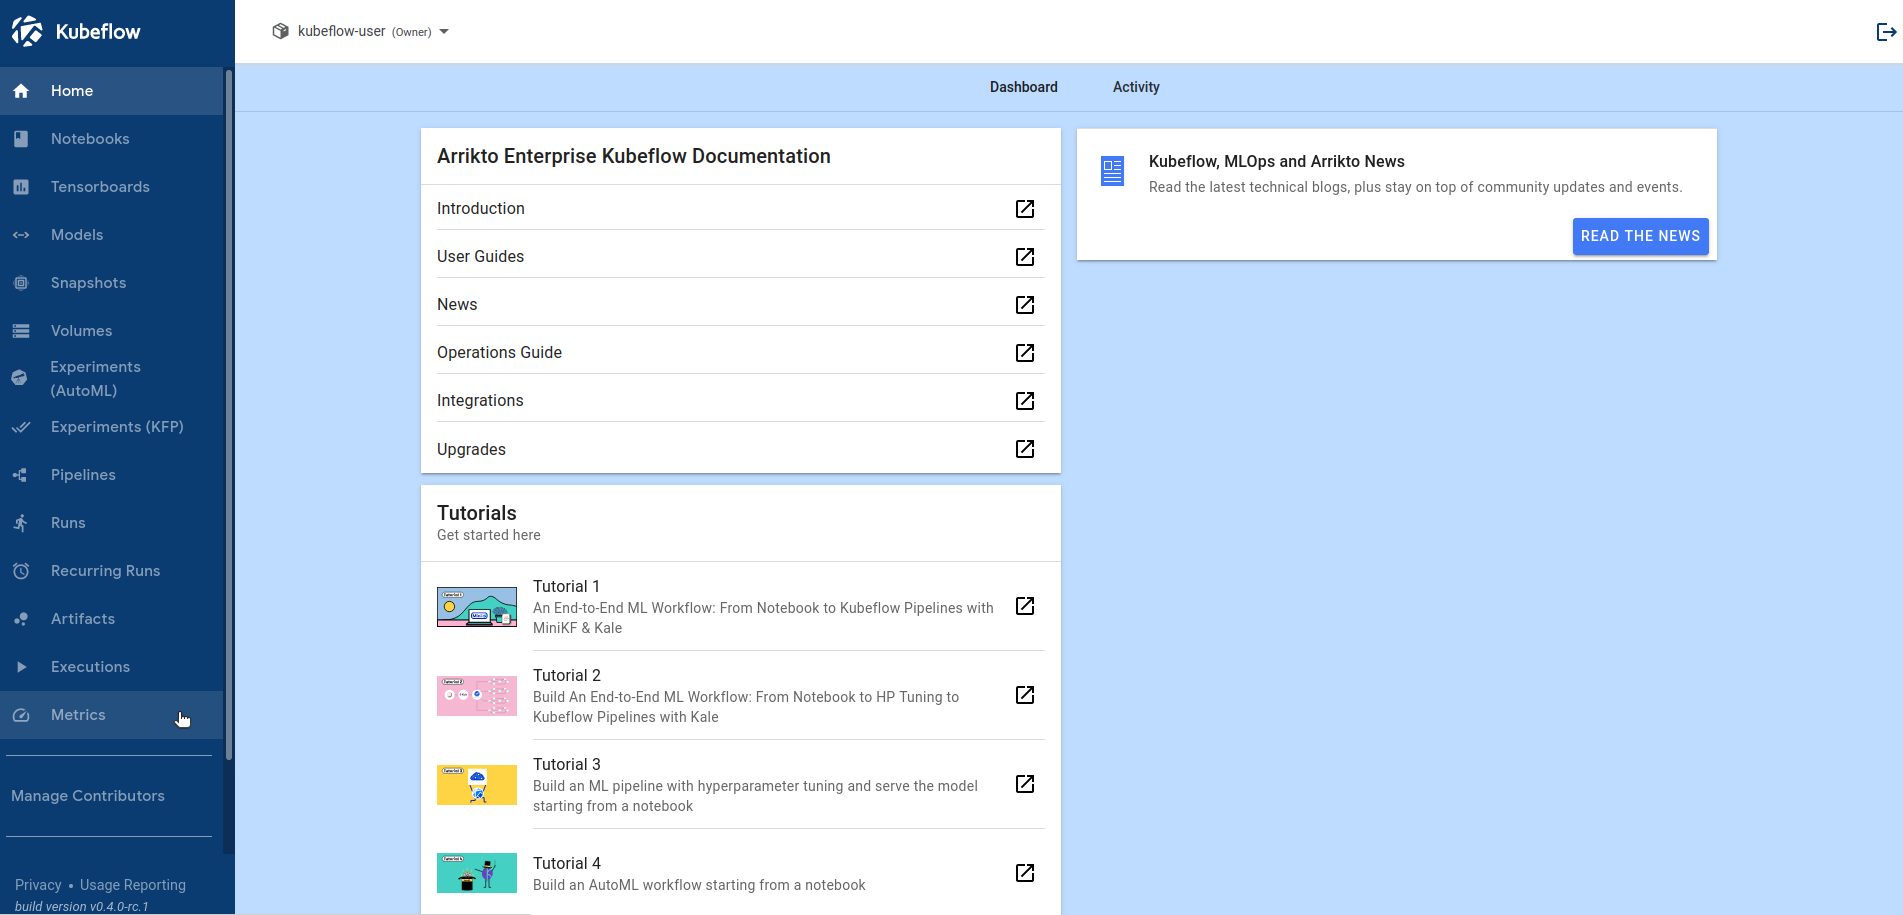
Select Metrics from the left side bar to navigate to Grafana:
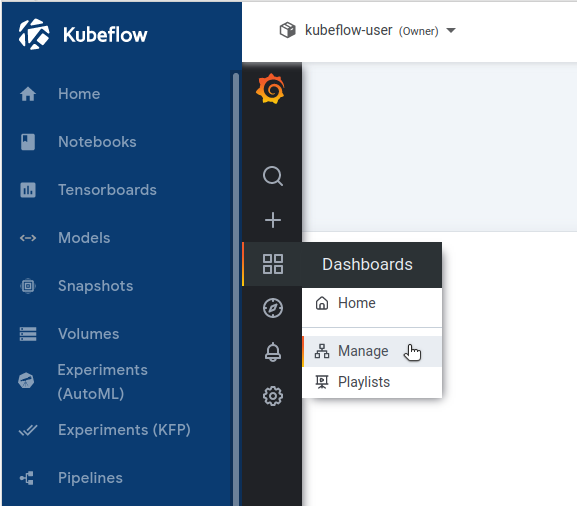
In the left side bar, hover your cursor over the Dashboards entry and then click Manage to navigate to the Grafana Dashboards page:
Note
In the Grafana Dashboards page you can search, view, and select dashboards.
Choose one of the following options, based on your needs and preferences:
Go to the
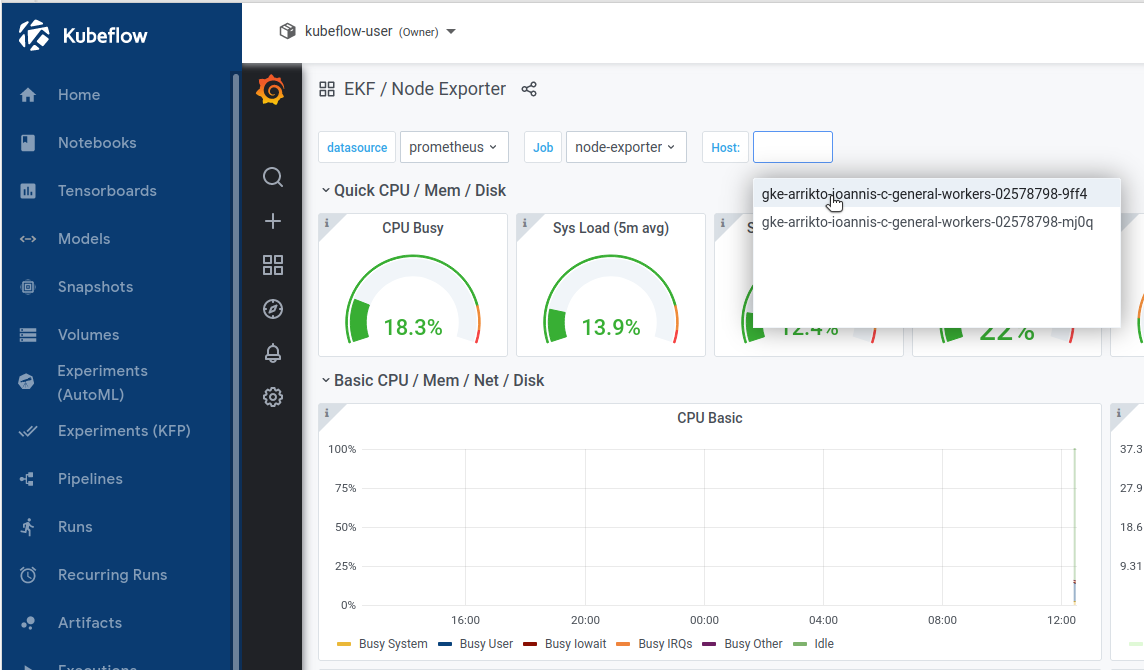
EKFfolder and select the Node Exporter dashboard: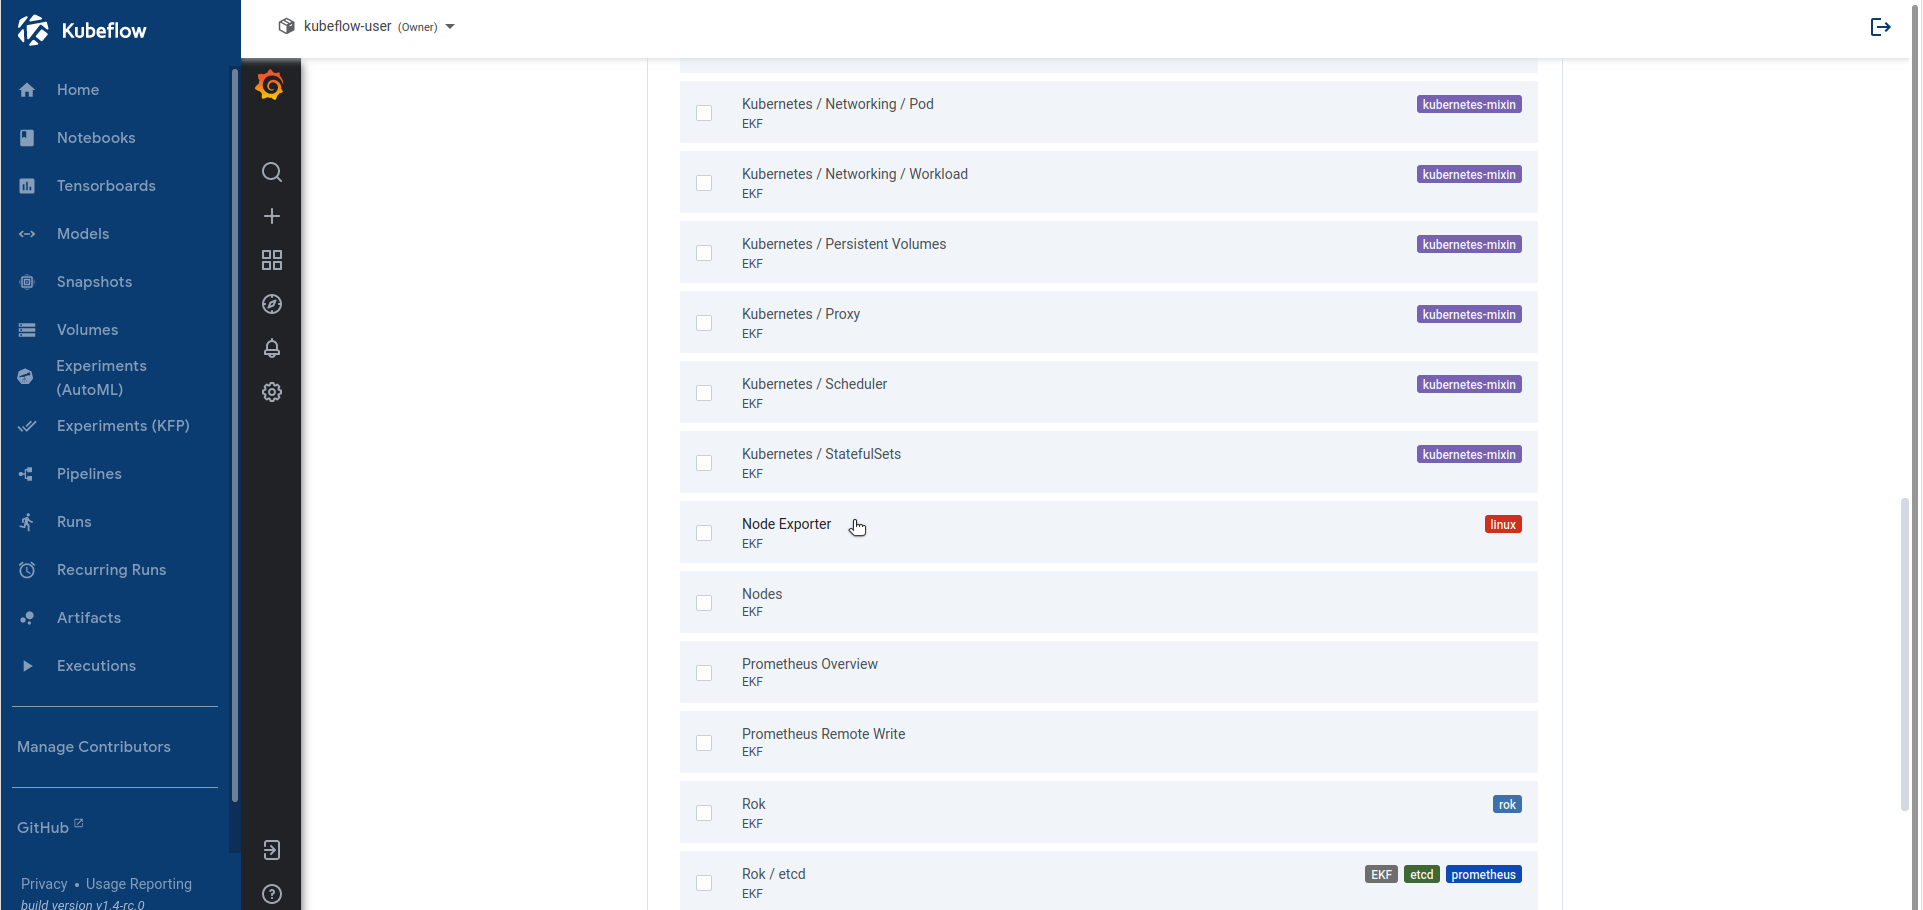
Set the Host dashboard variable by selecting one of the cluster nodes from the dropdown menu:
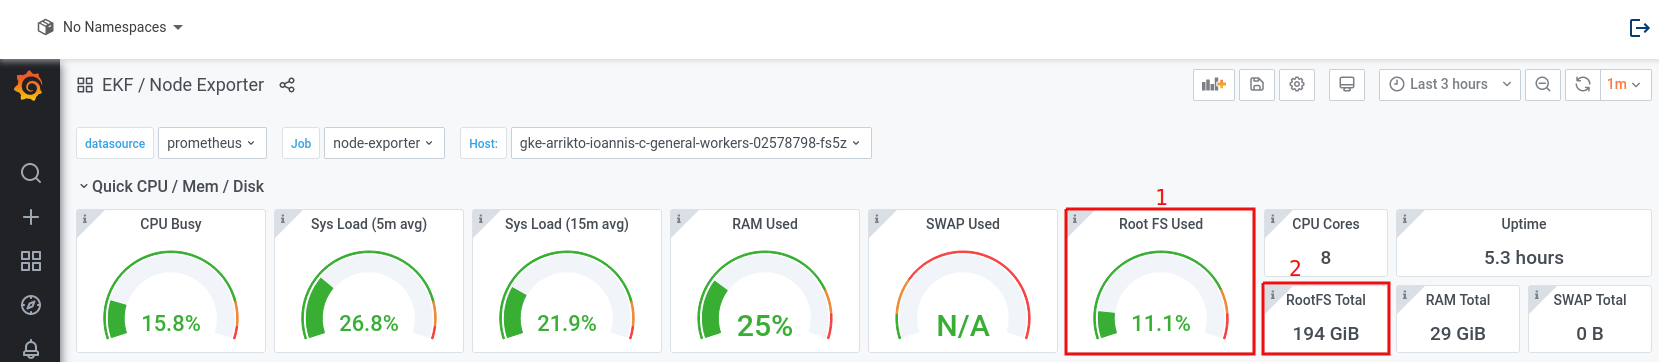
View the Root FS Used and RootFS Total panels in the Quick CPU / Mem / Disk row to inspect the used and total filesystem space for the selected cluster node:
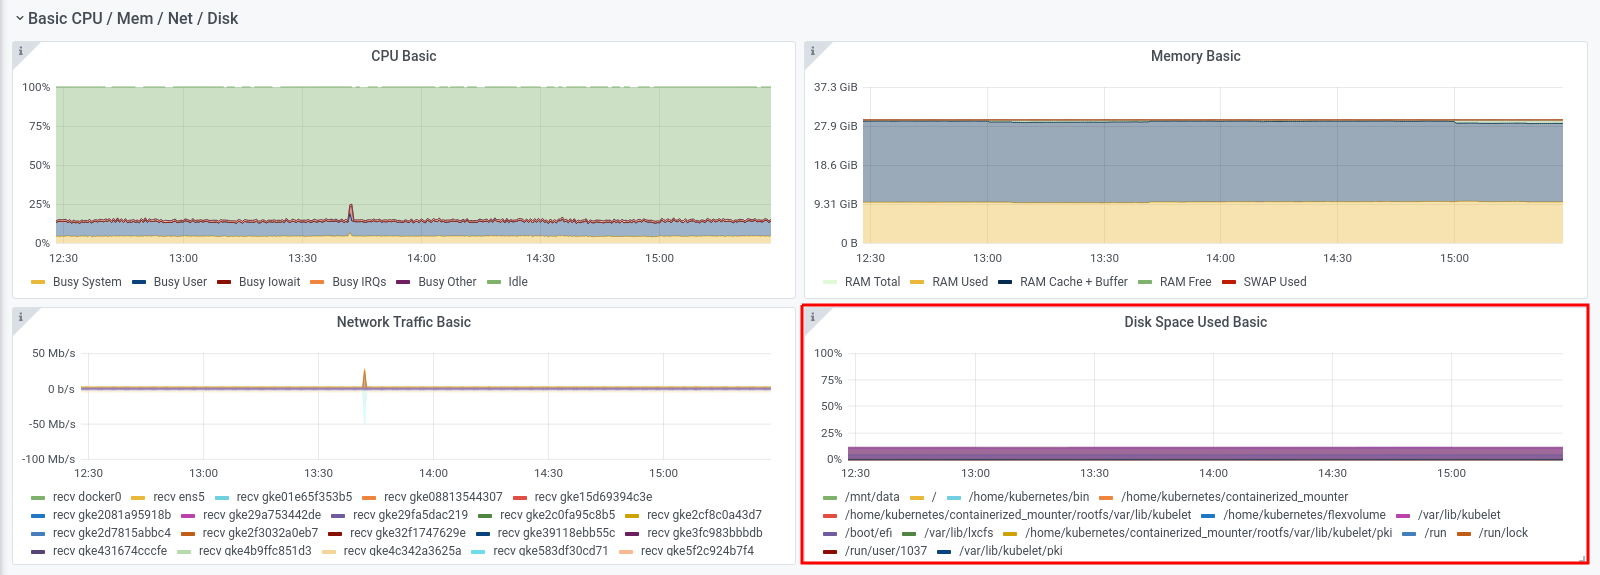
View the Disk Space Used Basic panel in the Basic CPU / Mem / Net / Disk row to inspect the percentage of disk space each mountpoint takes up for selected cluster node:
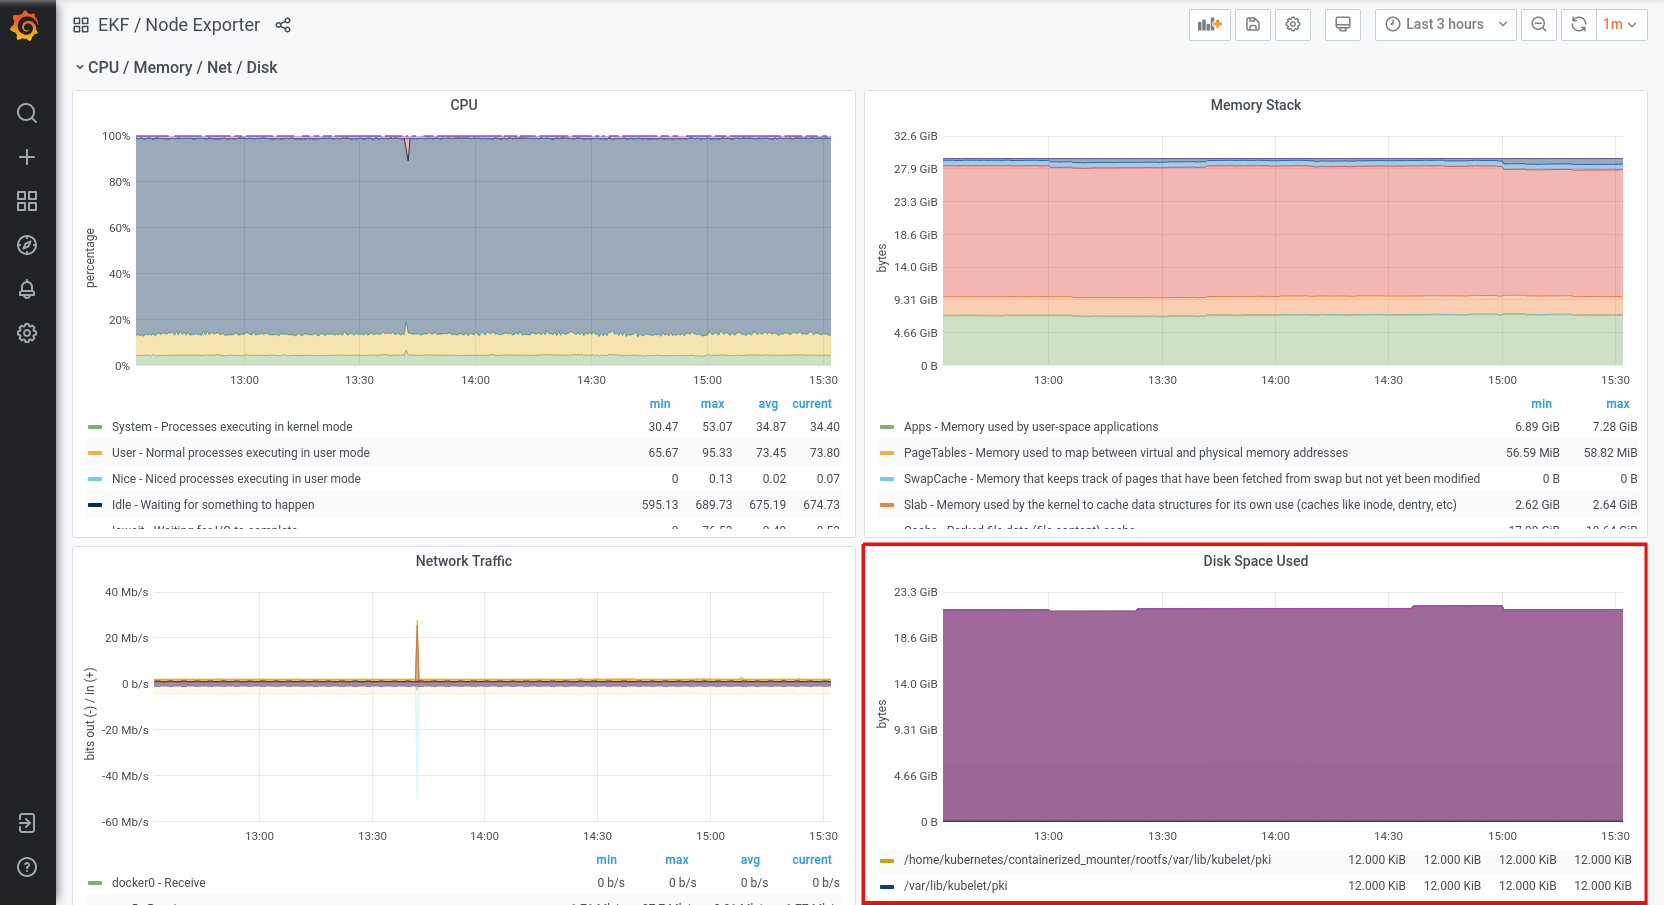
View the Disk Space Used panel in the CPU / Mem / Net / Disk row to inspect the amount of disk space each mountpoint takes up for the selected cluster node:
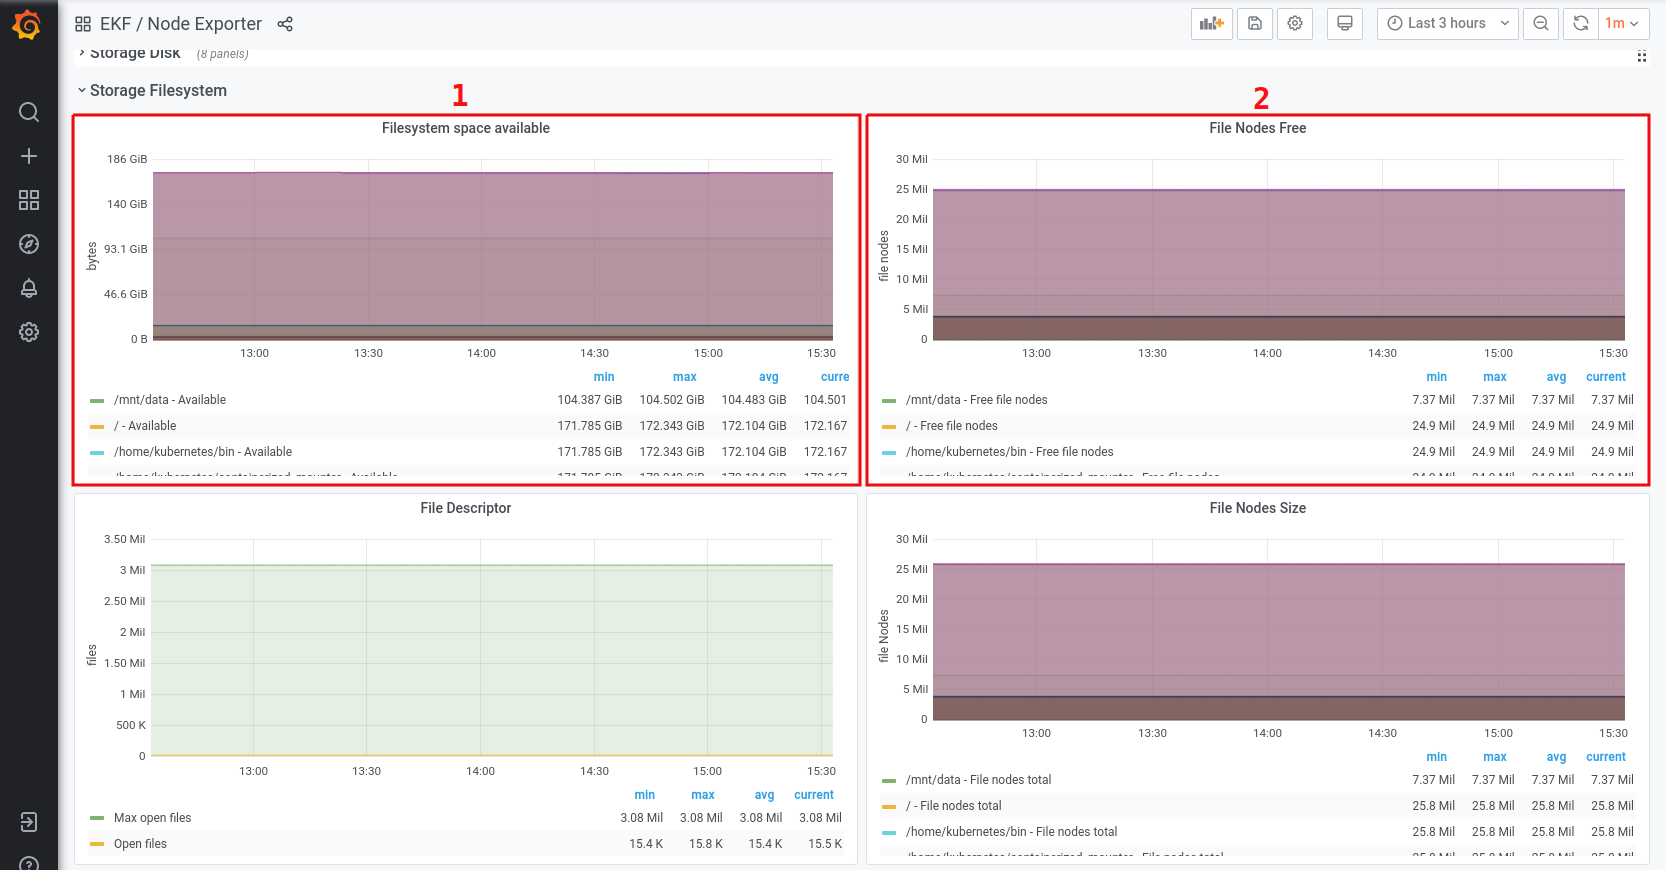
View the File System space available and File Nodes Free panels in the Storage Filesystem row to inspect how much available disk space and how many free file nodes each mountpoint has for the selected cluster node:
Go to the
EKFfolder and select the Nodes dashboard: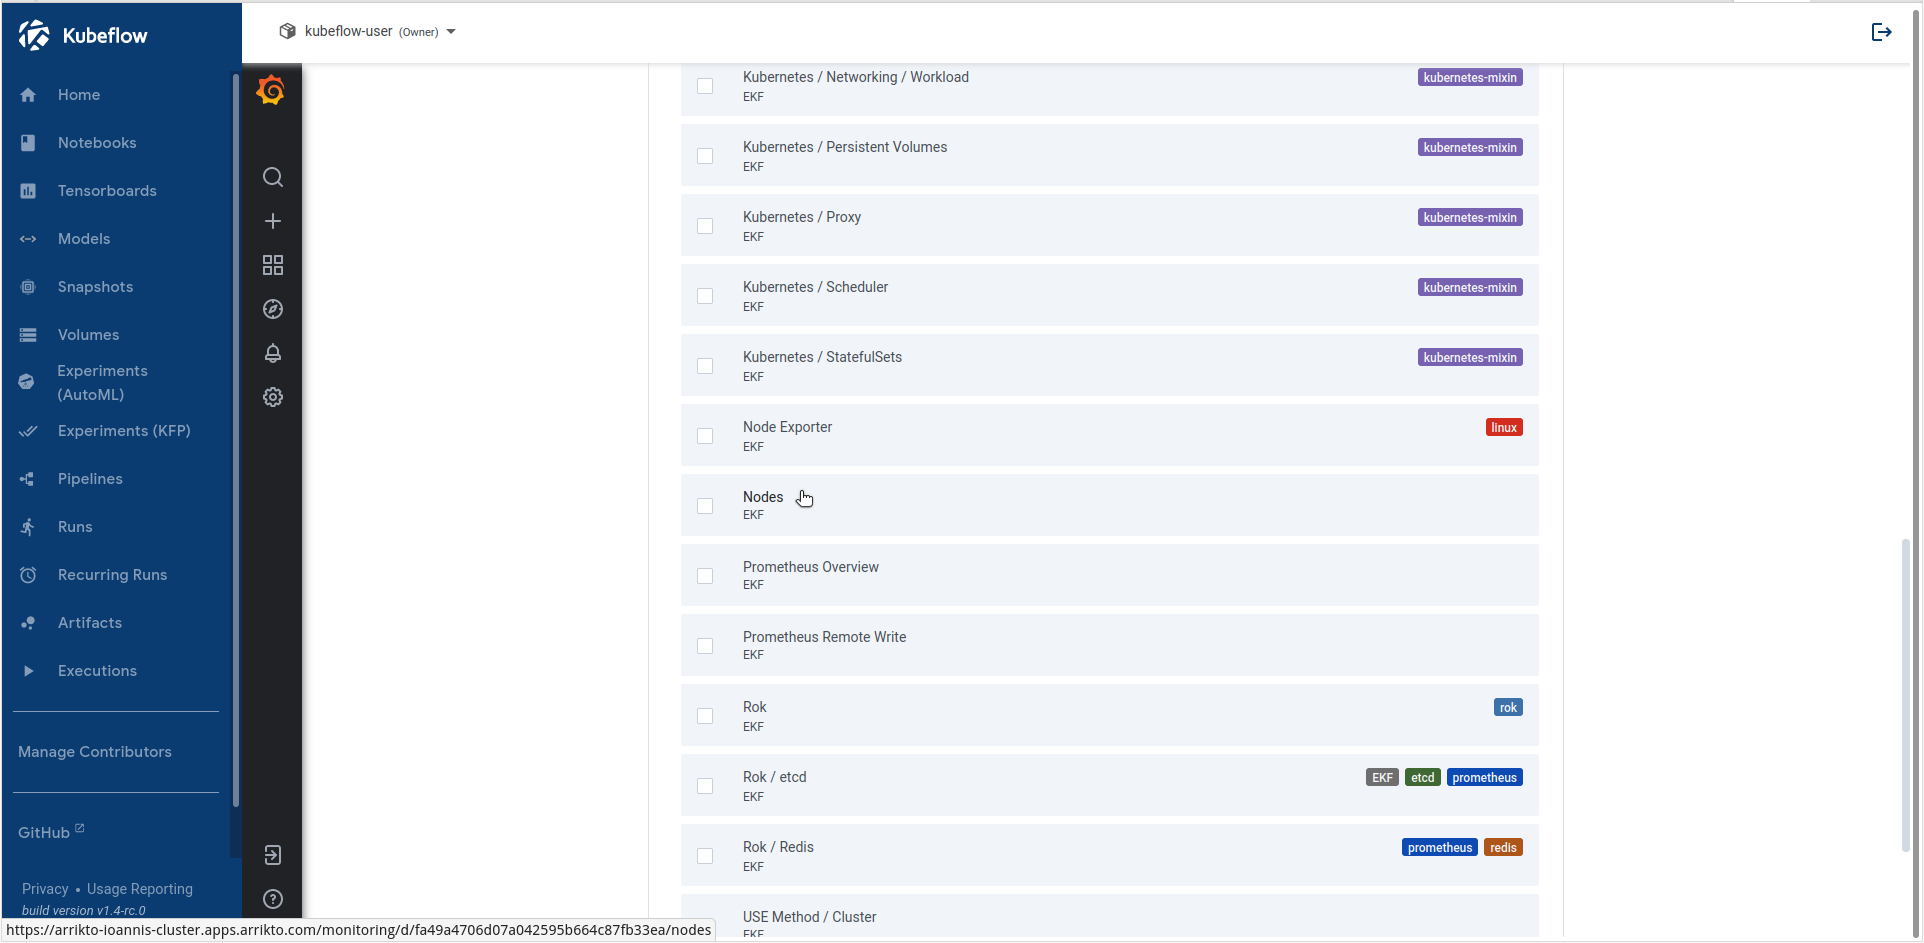
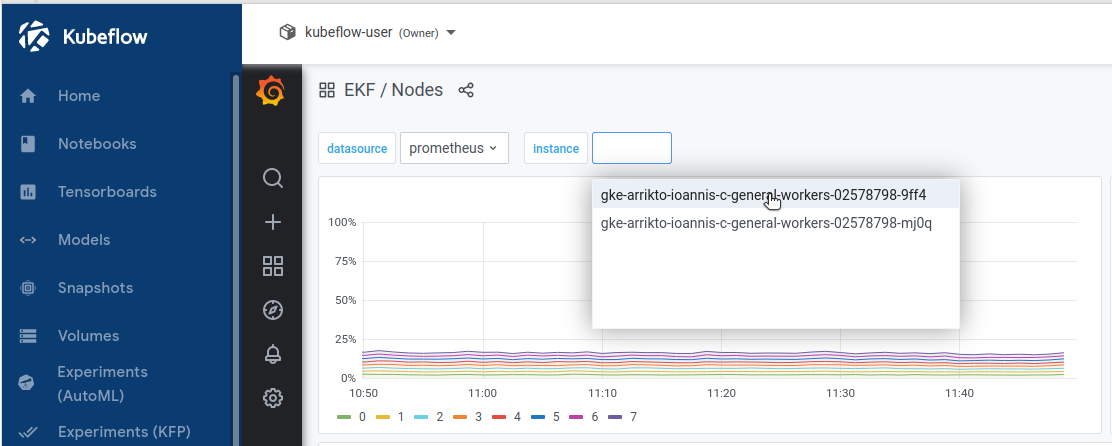
Set the instance dashboard variable by selecting one of the cluster nodes from the dropdown menu:
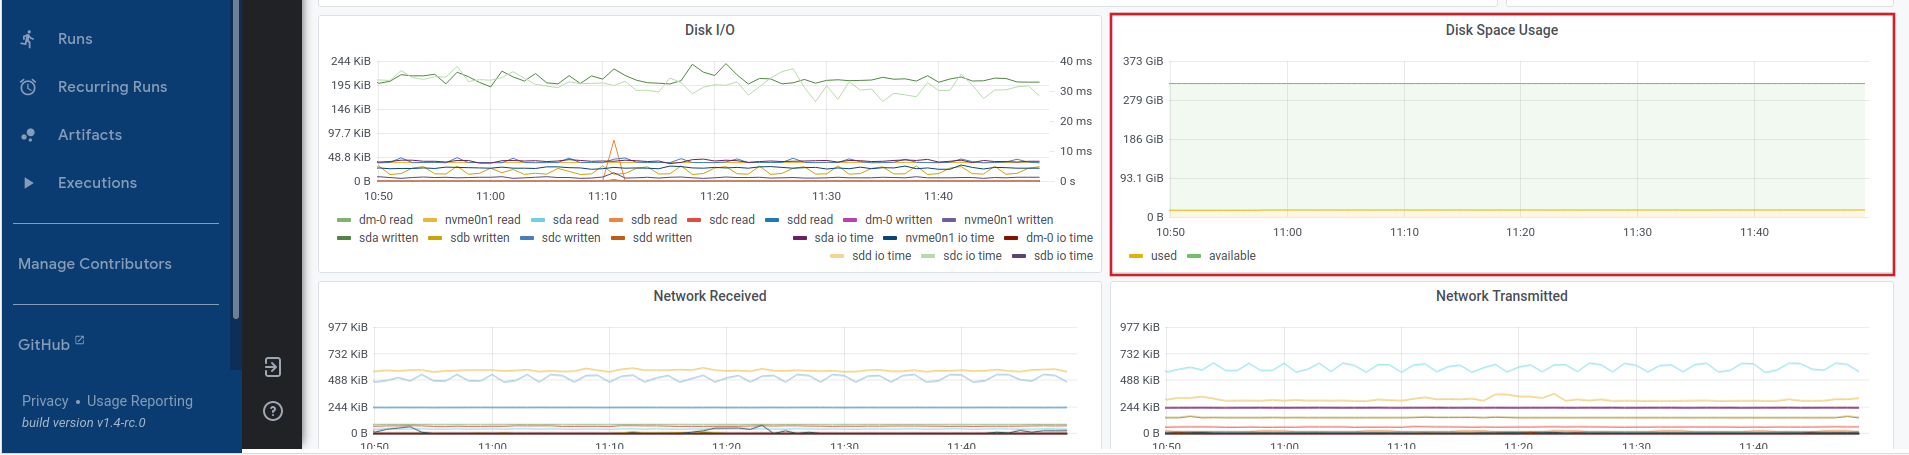
View the Disk Space Usage panel to inspect the used and available space for the selected node:
Go to the
EKFfolder and select the USE Method / Node dashboard: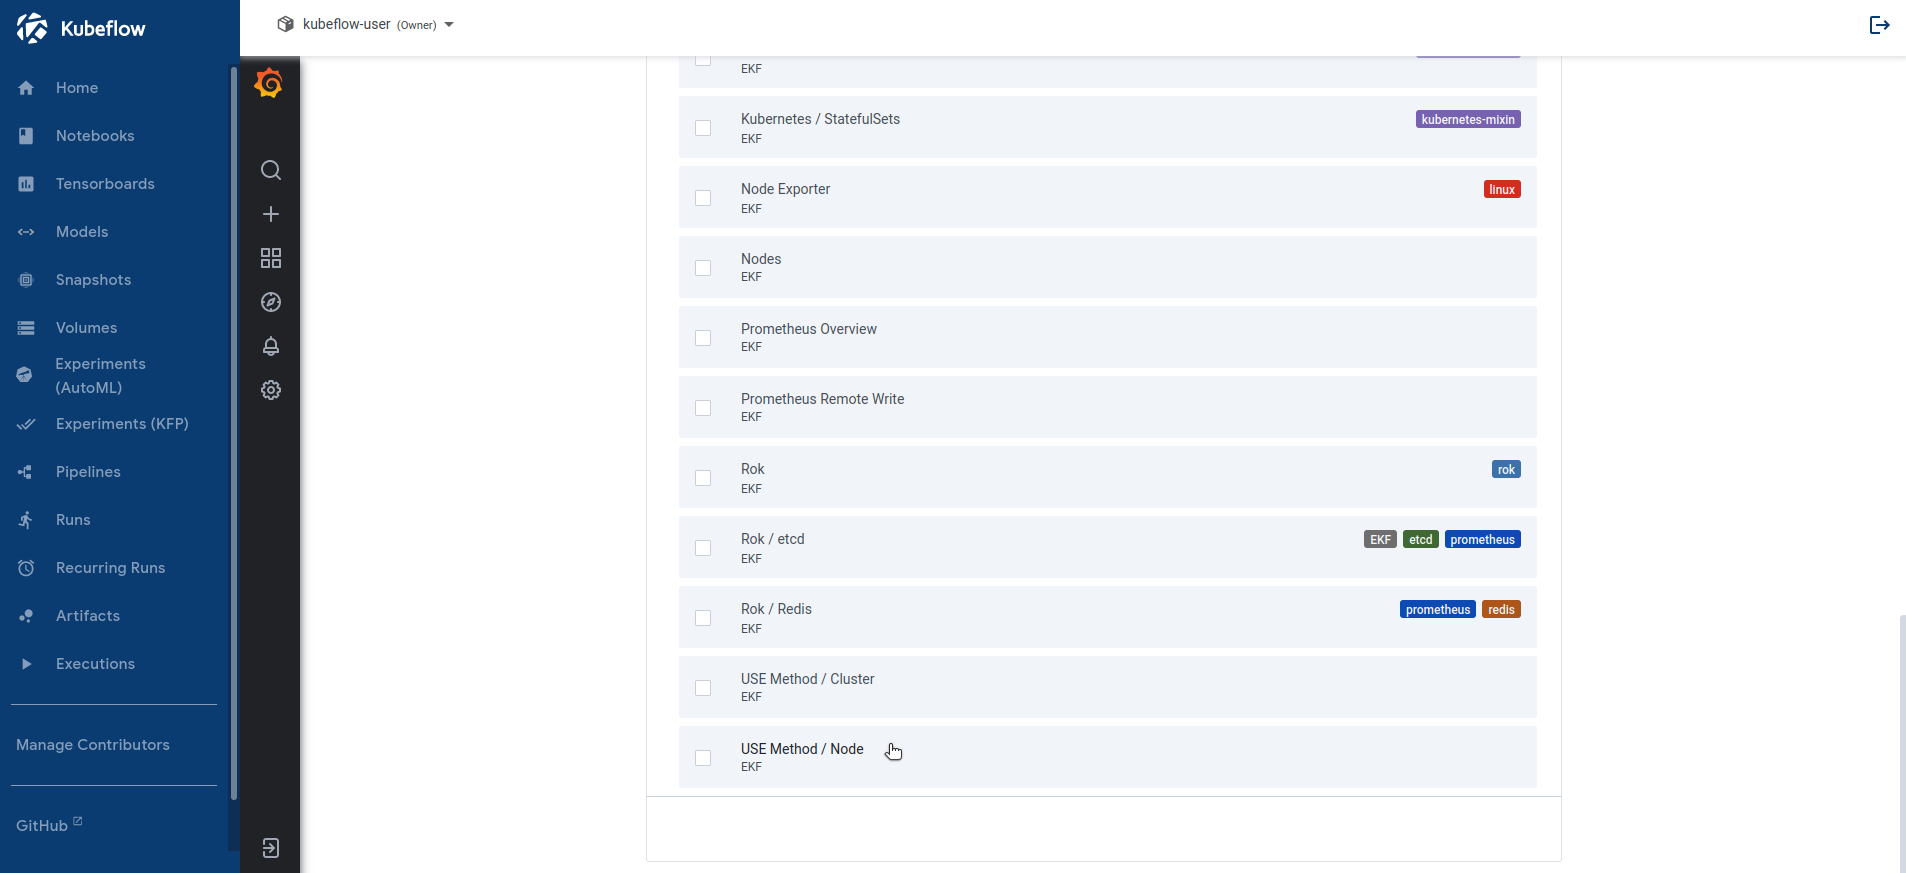
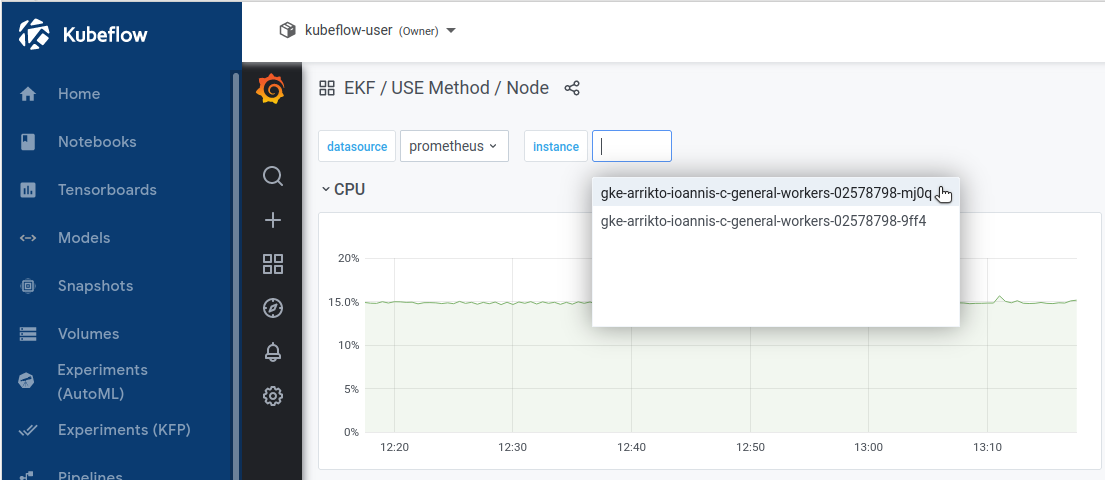
Set the instance dashboard variable by selecting one of the cluster nodes from the dropdown menu:
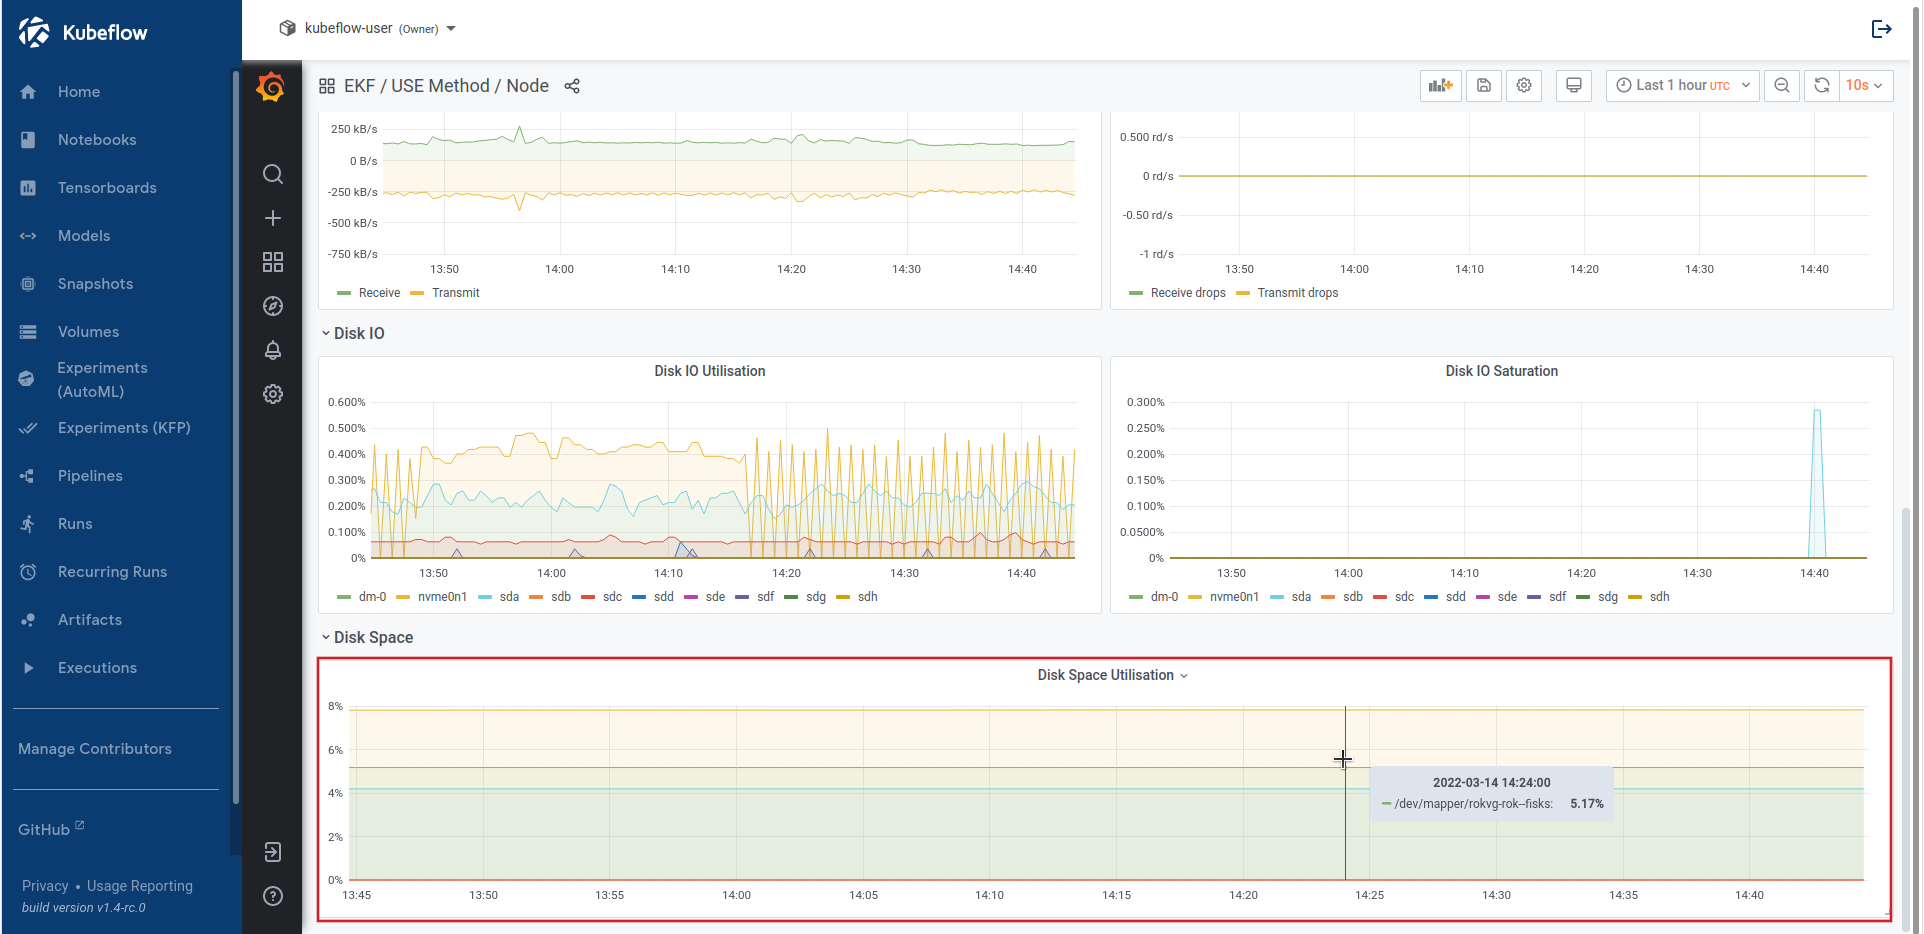
View the Disk Space Utilisation panel to inspect the used space for the selected cluster node:
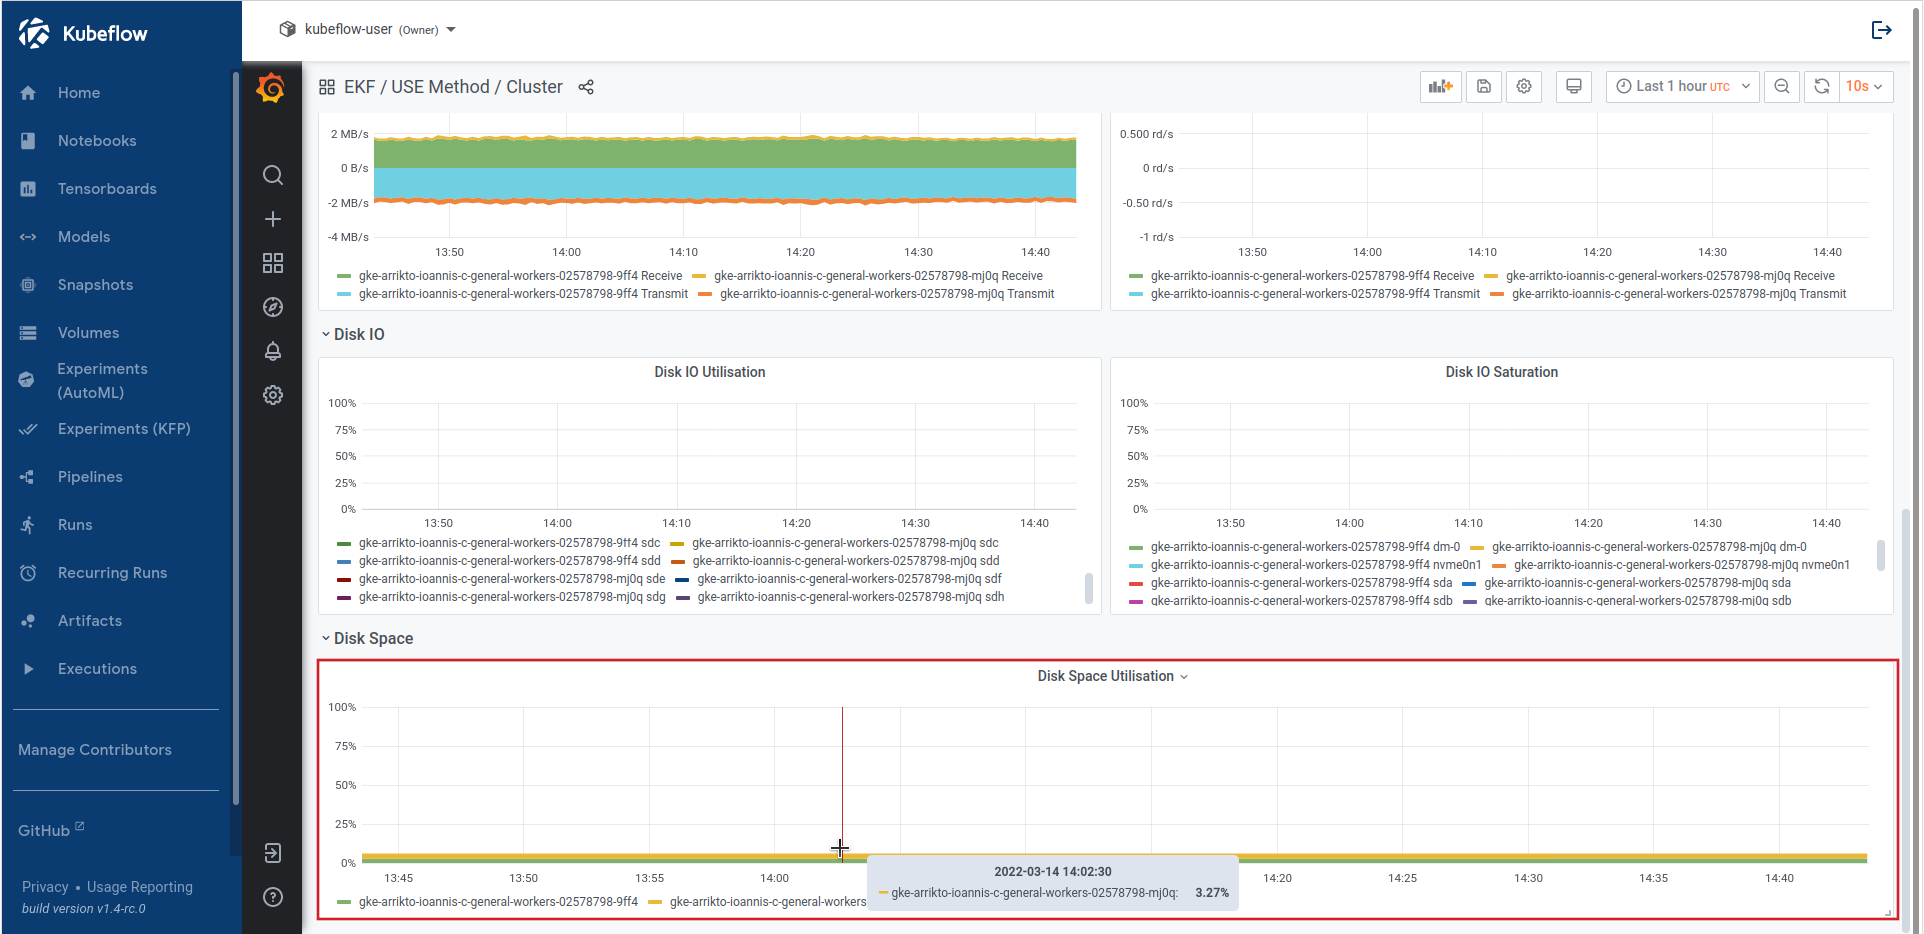
Go to the
EKFfolder and select the USE Method / Cluster dashboard: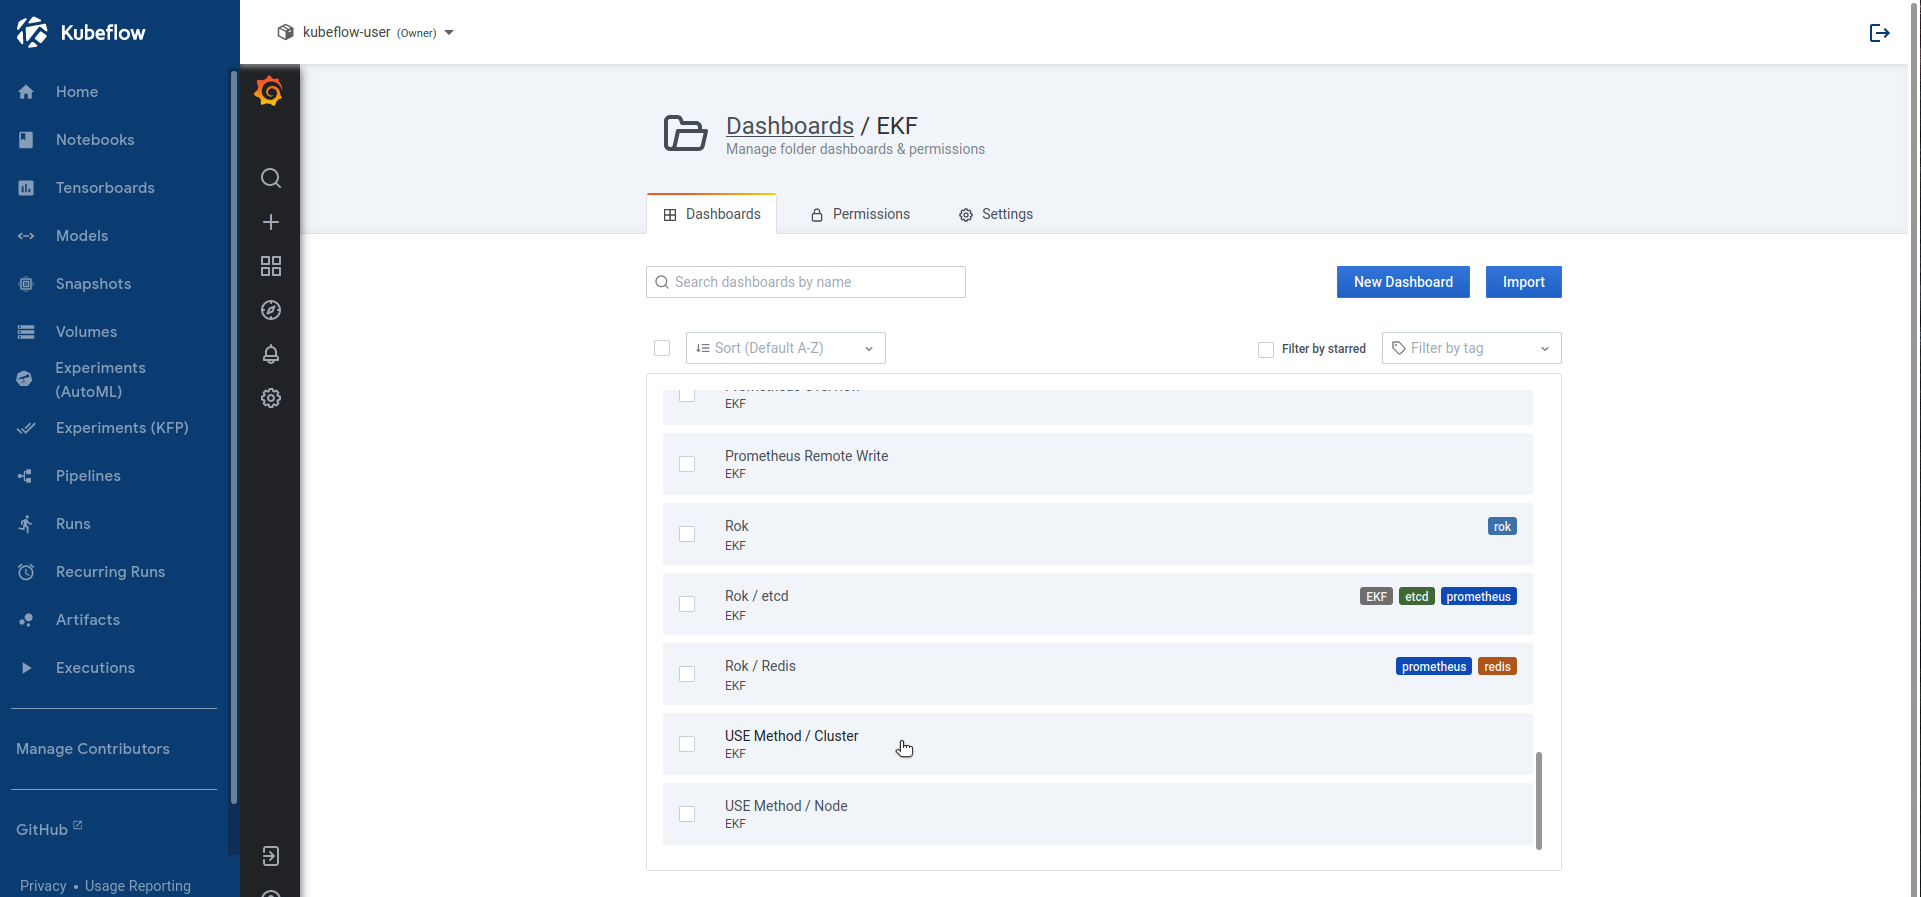
View the Disk Space Utilisation panel to inspect the used space for all cluster nodes:
Summary
In this guide you gained insight on how to monitor the available space of your EKF cluster nodes with the Rok Monitoring Stack.
What’s Next
The next step is to learn how to monitor Rok etcd and view the Rok etcd Grafana dashboard.